Keep it as easy as a photo
Taking a measurement should feel like using a camera, not operating an instrument.
Computer vision / Specialty coffee / 0 to 1
RoastPic uses computer vision to measure bean size, roast color, and visible defects from a single photo, making physical coffee analysis more accessible to smaller roasteries.
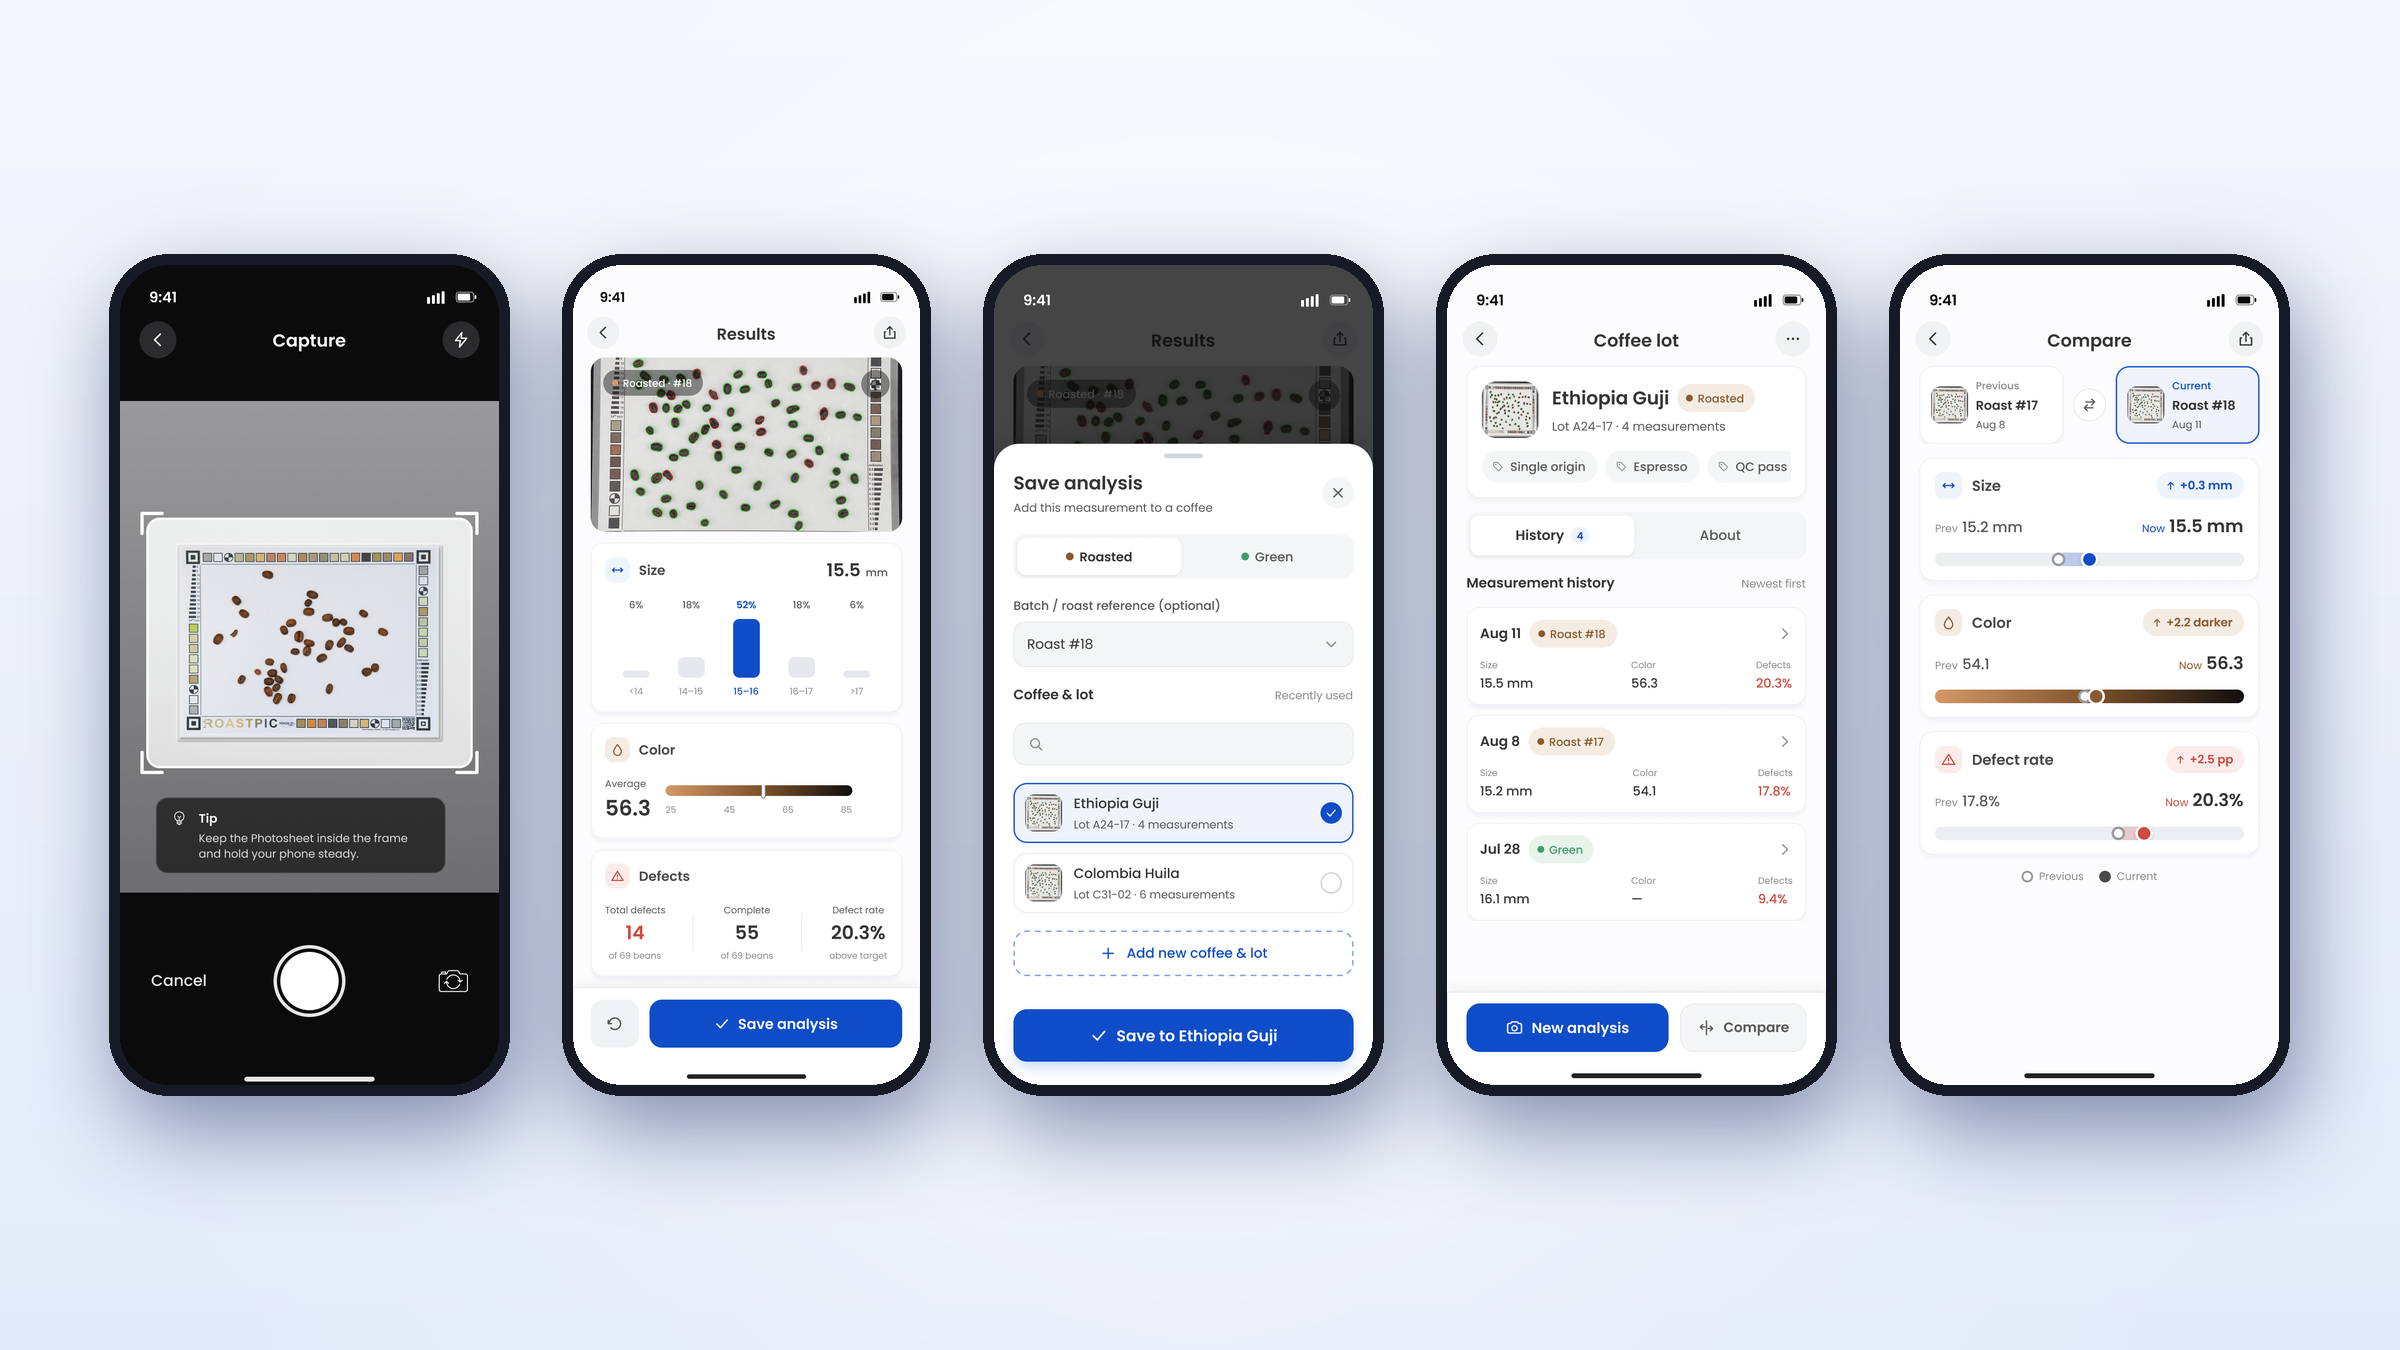
Role & impact
As the sole product designer, I took RoastPic from its initial MVP into a more persistent visual QC experience. After our early pilots, I led research to understand where RoastPic’s measurements fit within roasters’ broader quality workflow, defined the direction for the next release, and translated those findings into a new information architecture, database, history, and comparison experience.
Problem
For coffee professionals, understanding a bean goes beyond tasting it. Physical characteristics such as size, roast color, and defects provide important signals for evaluating consistency and quality.
Traditionally, collecting this data requires separate processes—from manual grading and defect inspection to dedicated roast-color equipment. For smaller roasteries, that can mean more labor, higher costs, and a fragmented workflow.
RoastPic started with a simple question:
What if roasters could get these measurements from the camera already in their pocket?
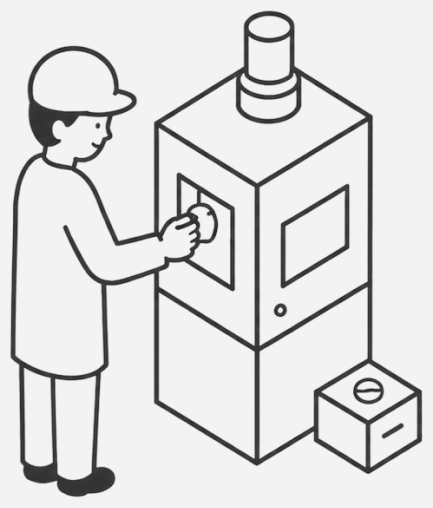
Each check needs its own tool and leaves its own record.
 Size
Size
Sorting beans by hand through sieves
 Color
Color
A dedicated benchtop colour reader
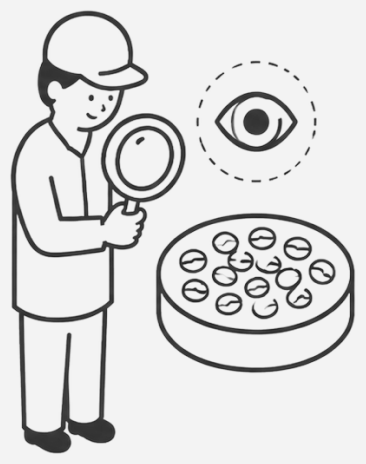 Defect
Checking bean by bean against a chart
All three checks come out of a single photo.
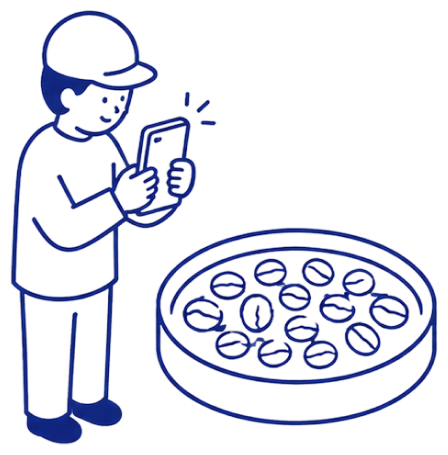 Take one photo
Beans on a printed reference sheet
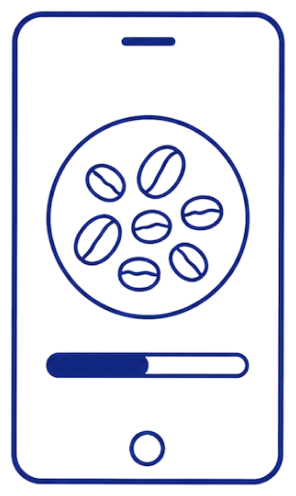 RoastPic analysis
The app reads the beans against the sheet
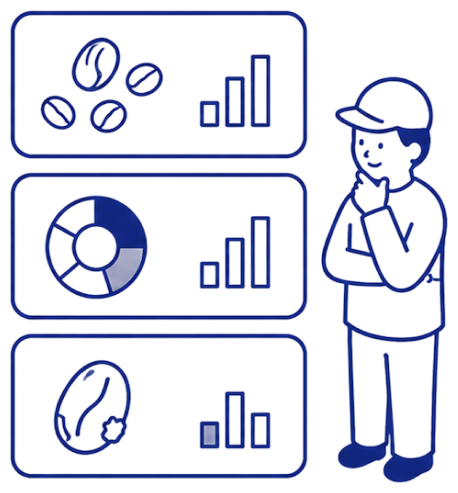 All three results
Size, colour and damage, all at once
The MVP
The core technology was already working: with a calibrated Photosheet as a reference, RoastPic could turn a smartphone photo into measurements of bean size, roast color, and defects.
My goal at this stage was to turn that capability into a usable MVP—from taking a photo to receiving a result—while making the process feel simple enough for everyday use and reliable enough for roasters to trust.
I defined three principles to guide the first experience:
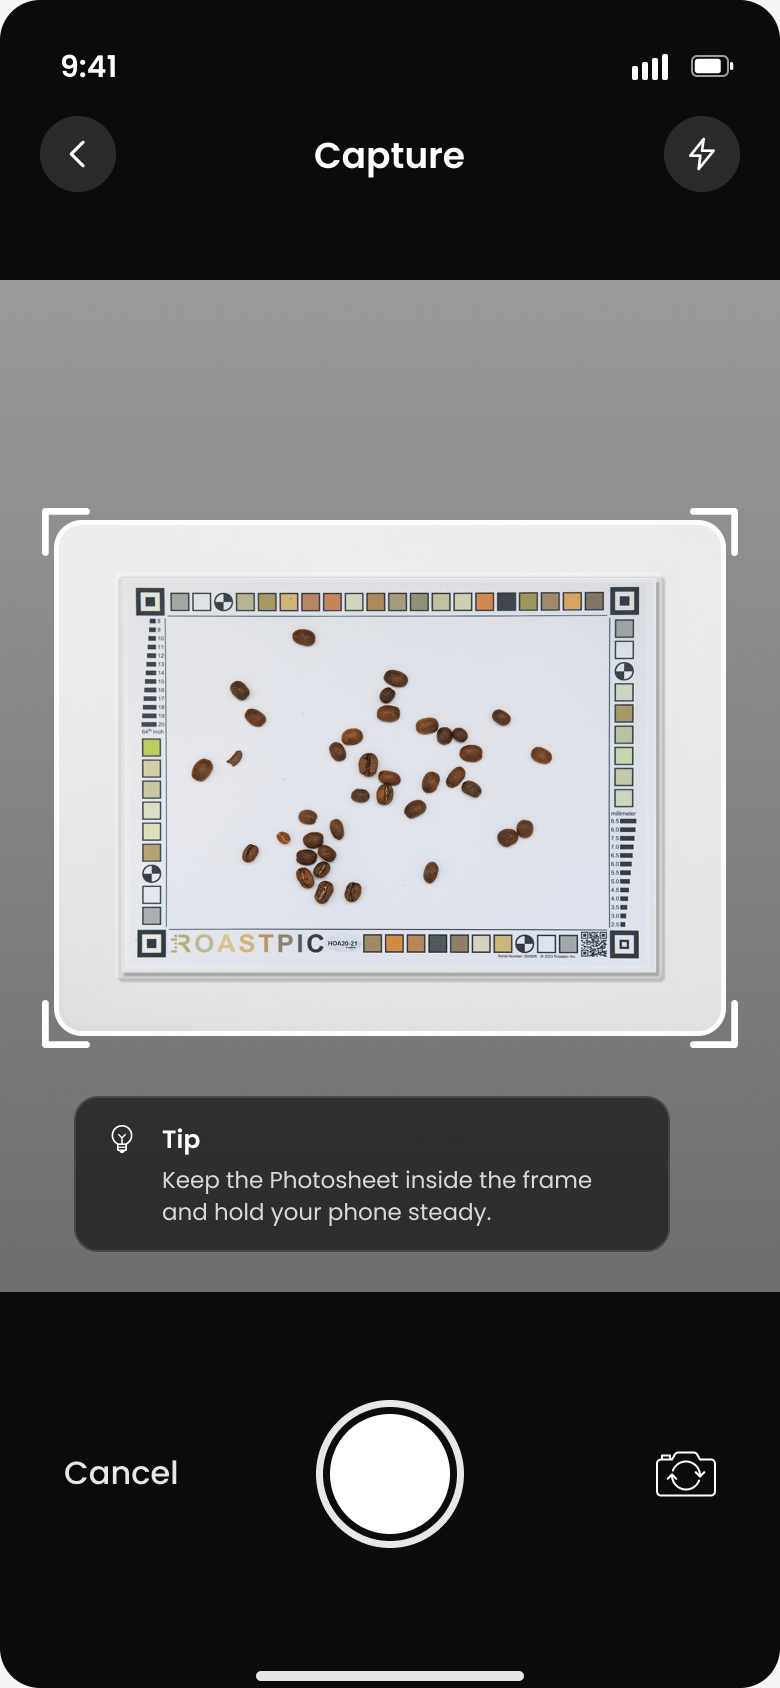
Taking a measurement should feel like using a camera, not operating an instrument.
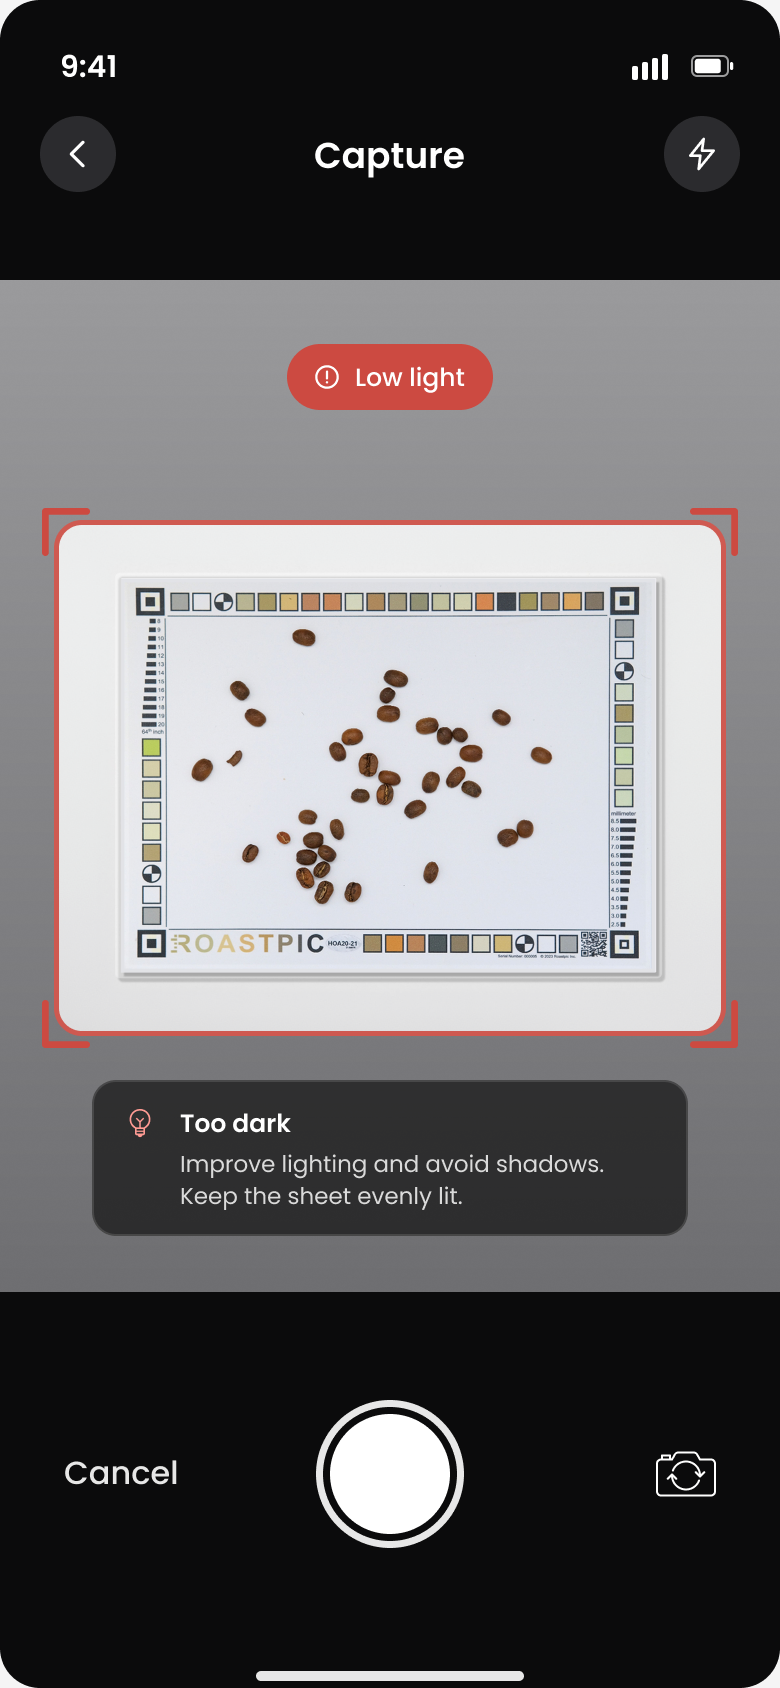
Lighting and bean placement change the result, so the app had to steer people towards a good photo without turning into a manual.
Numbers on their own are easy to doubt. People needed to see enough of the process to trust what came back.
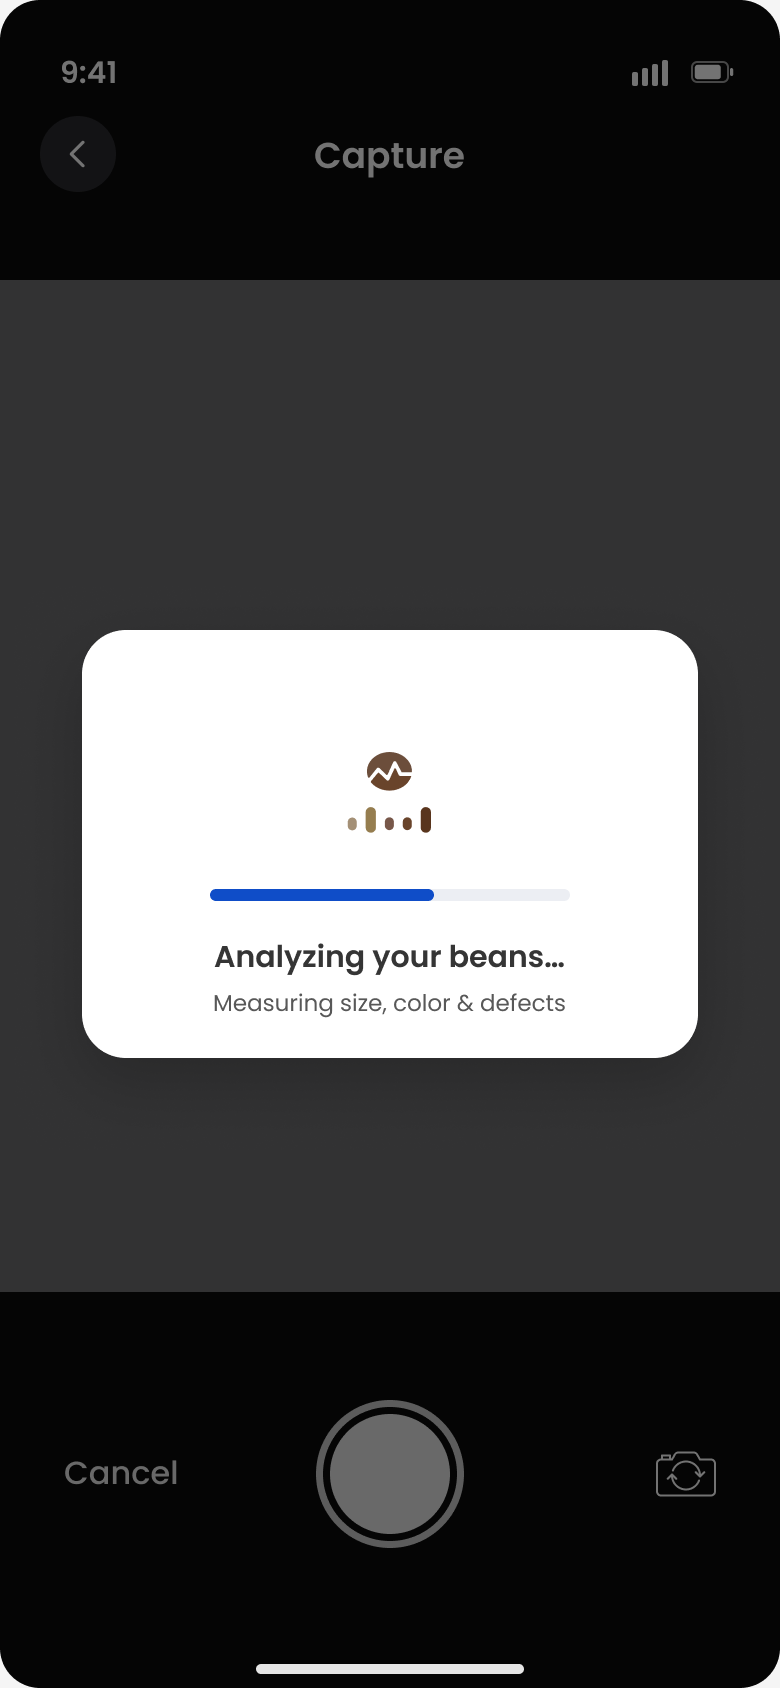
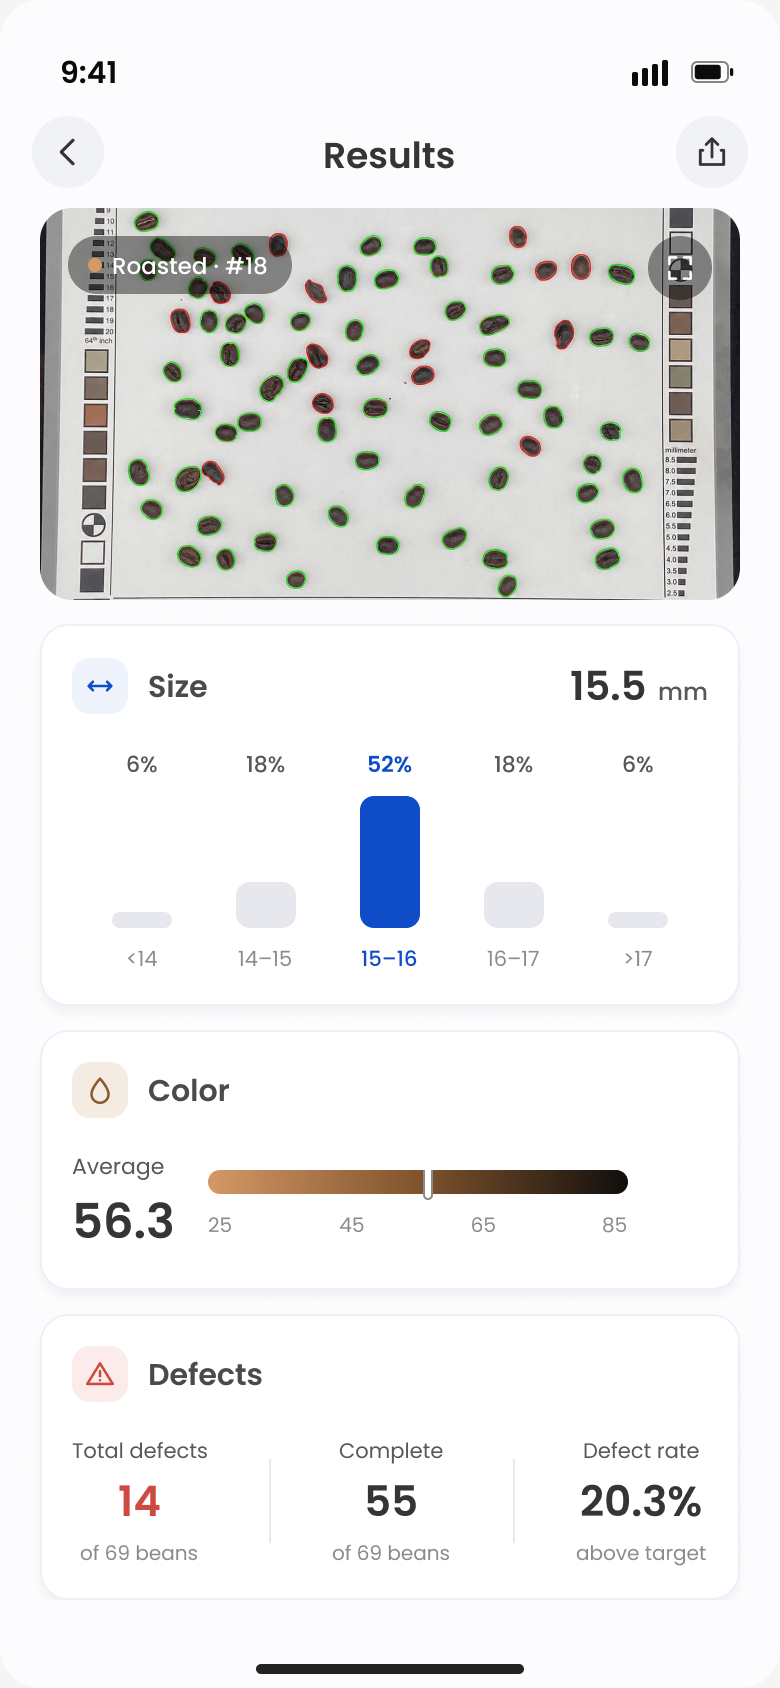
What testing revealed
The MVP validated the core idea: roasters could use a phone photo to capture physical measurements of size, color, and defects. Through user testing and feedback, I also found that a measurement rarely stood on its own. Roasters wanted to save results, connect them to a coffee or roast, and reference previous measurements over time.
Within a couple of weeks most of the pilot roasteries had stopped opening it. Nobody was complaining about the numbers, and the questions coming back were not about accuracy at all.
What roasters wanted to know
These needs pointed to a larger workflow beyond the measurement itself.
Research
To define what RoastPic should support next, I went back to our pilot roasteries and observed their quality-control workflow beyond the scan — how measurements were recorded, referenced, and used to evaluate future batches.
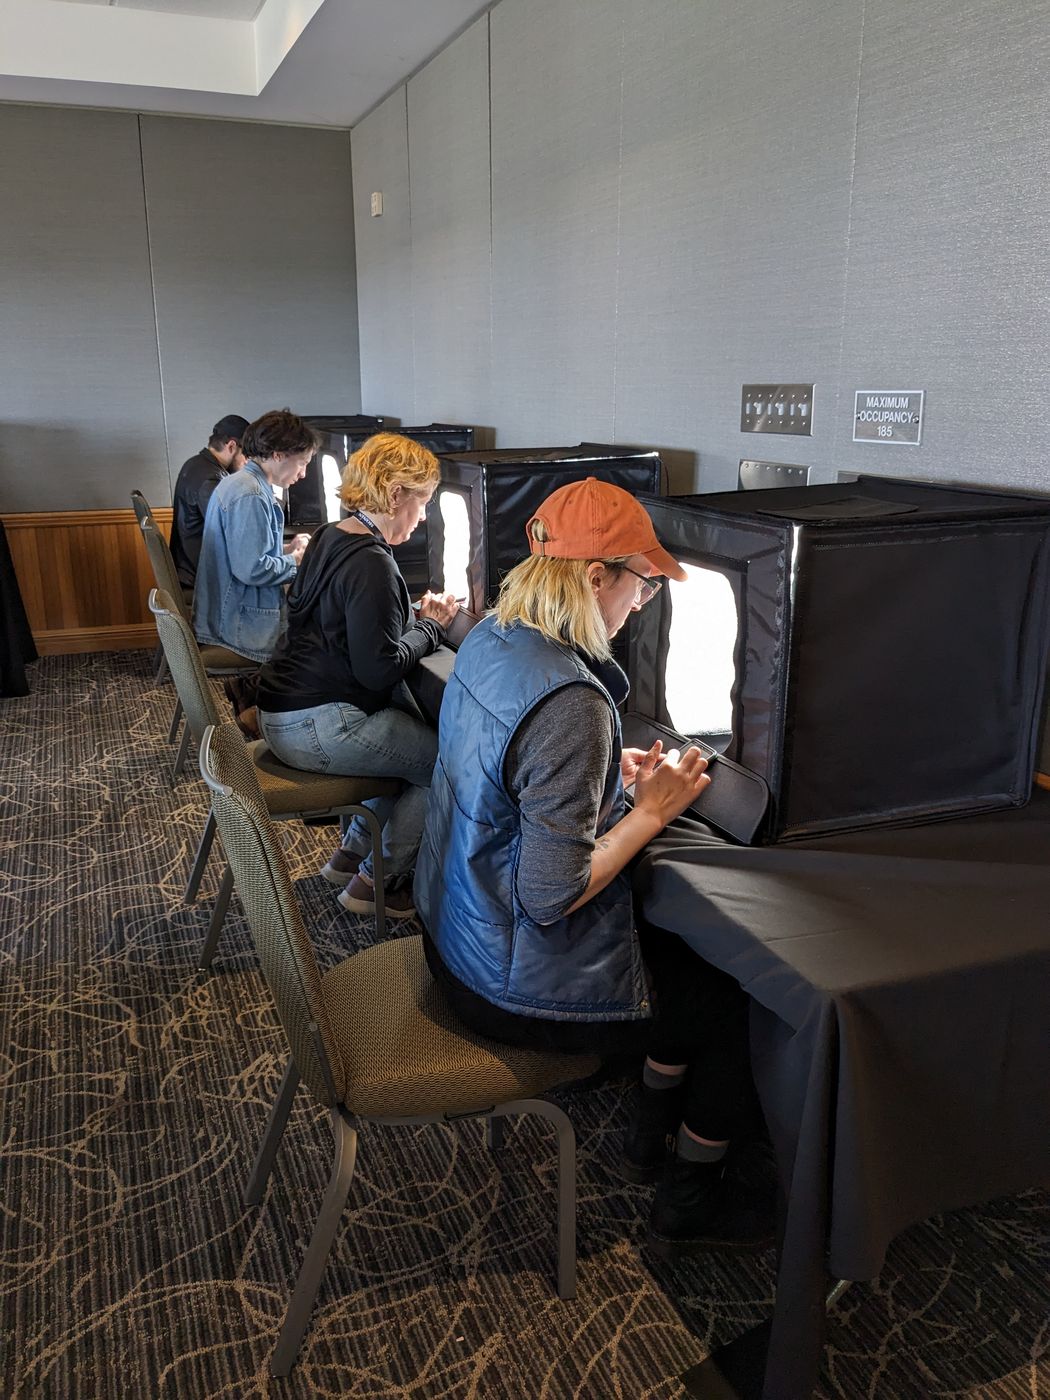
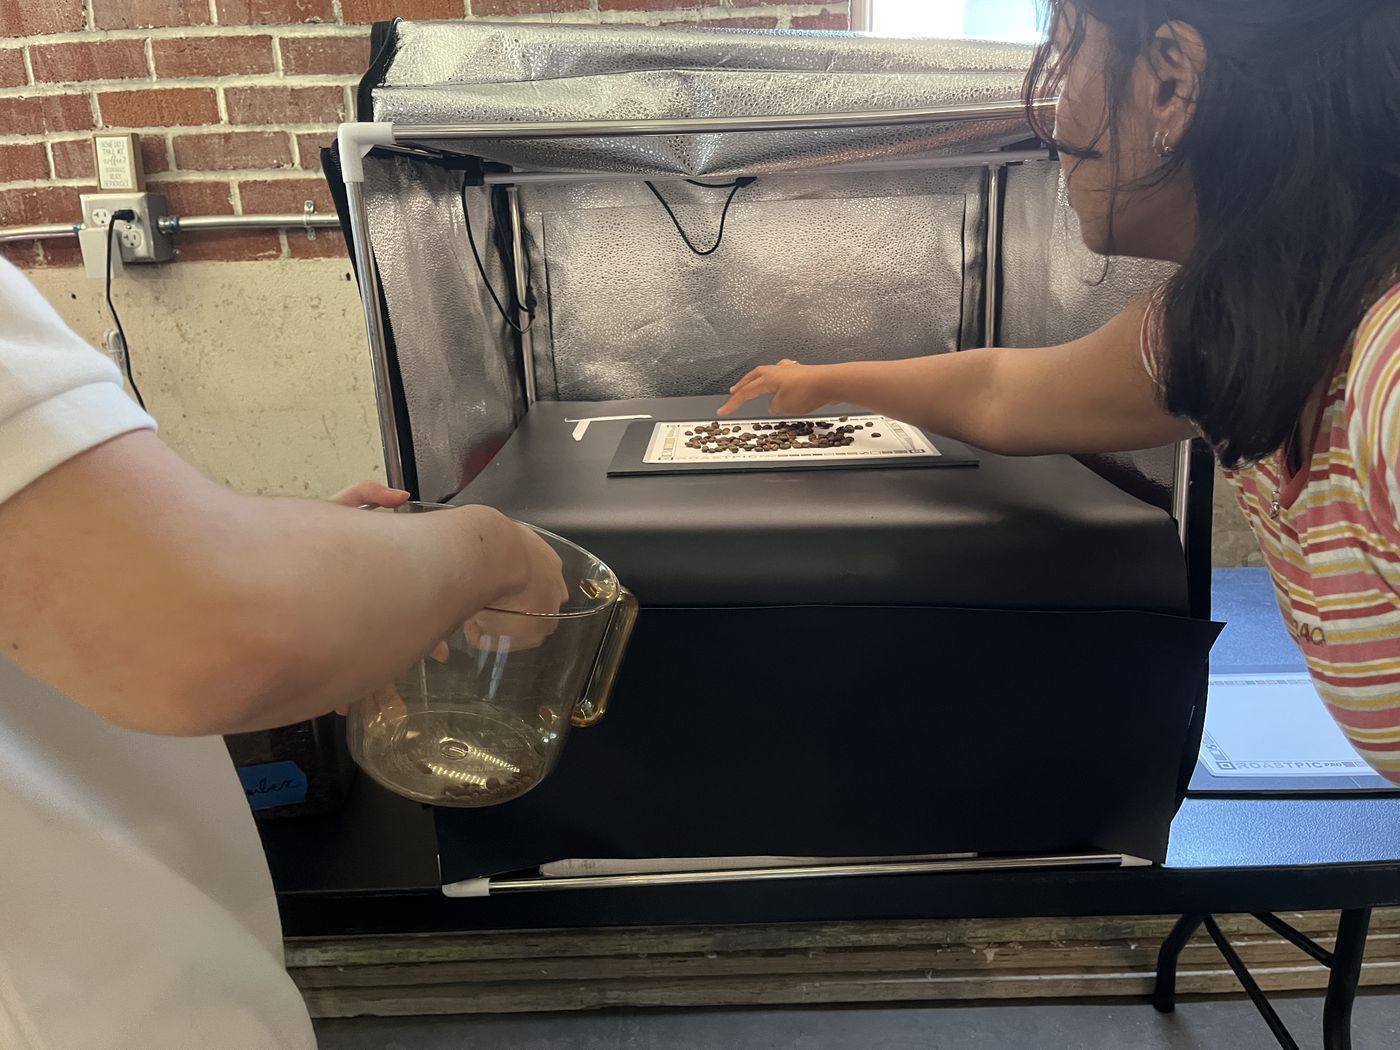
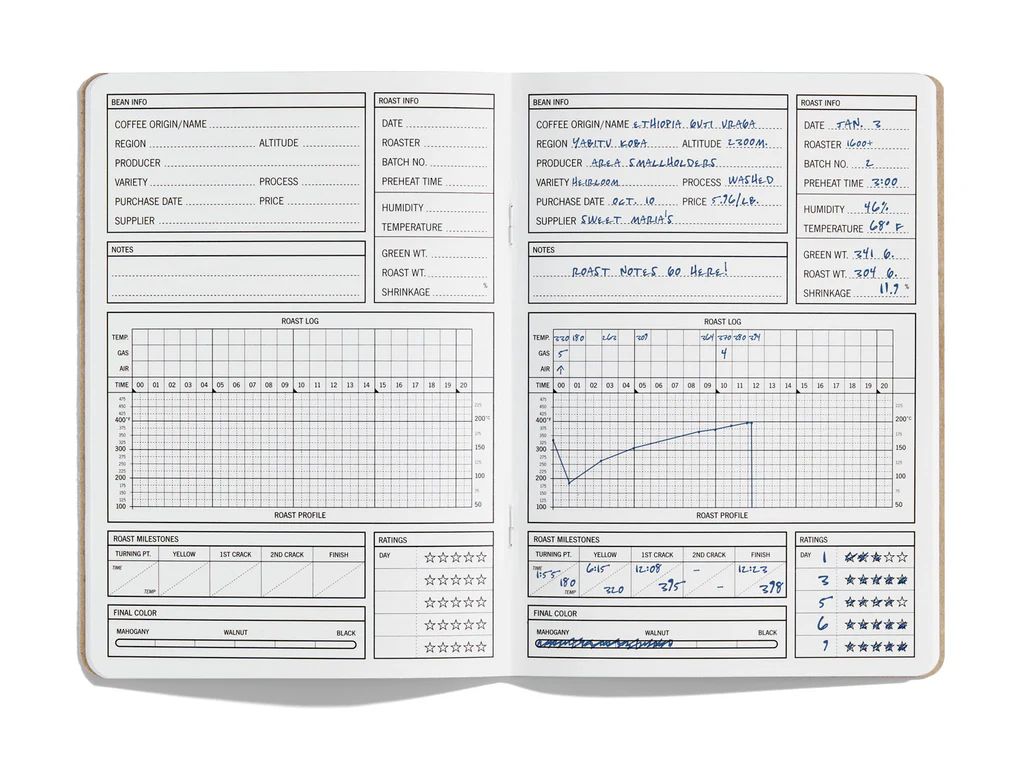
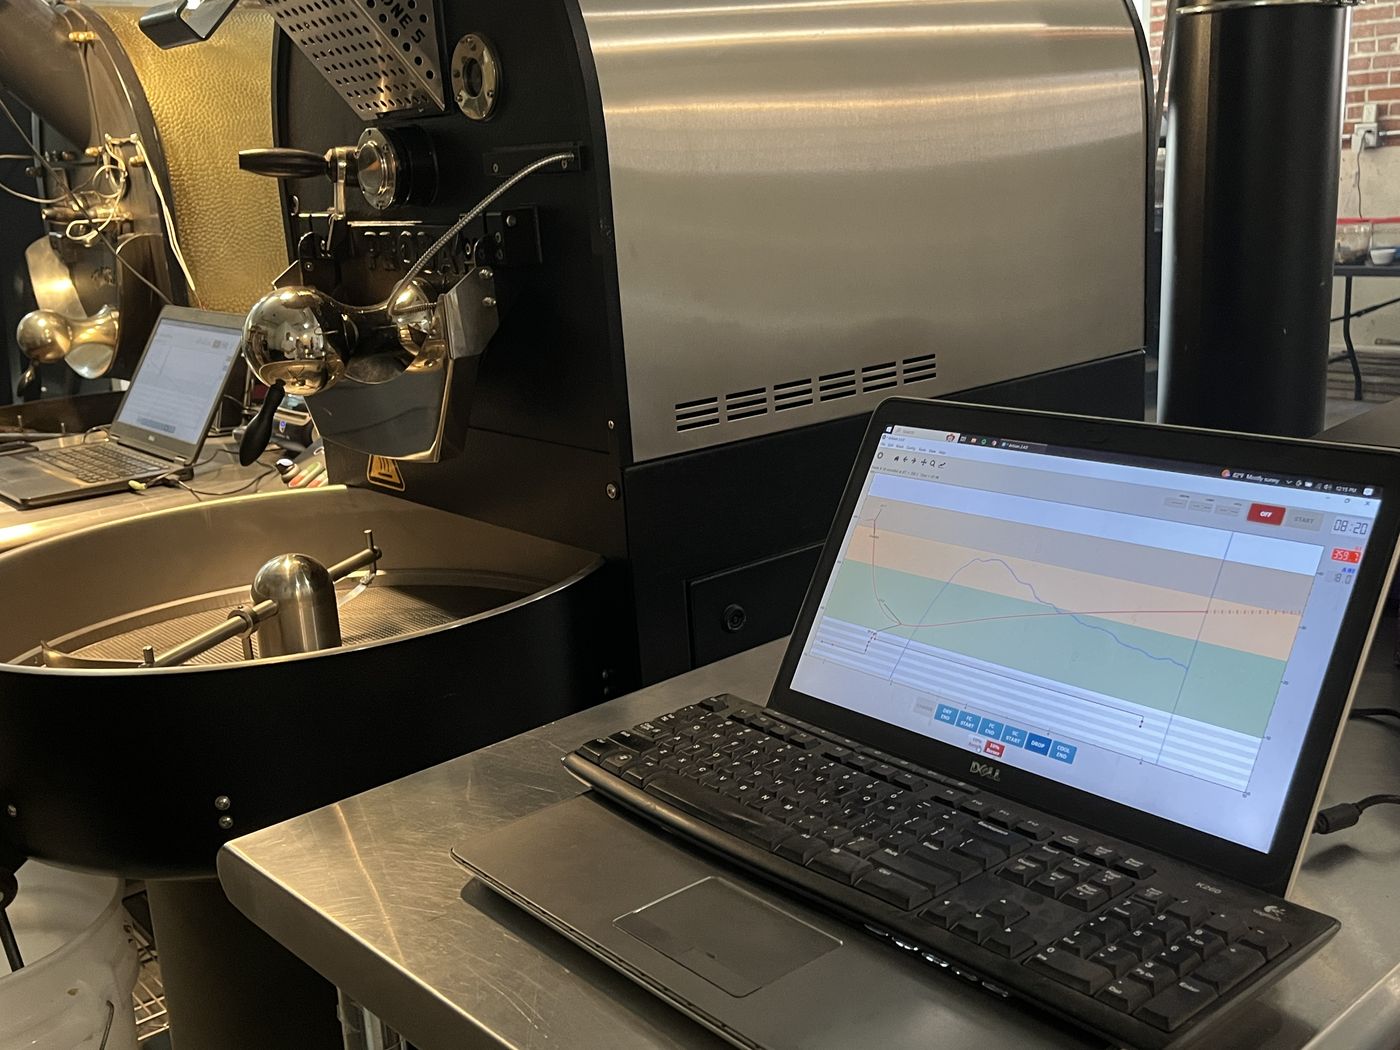
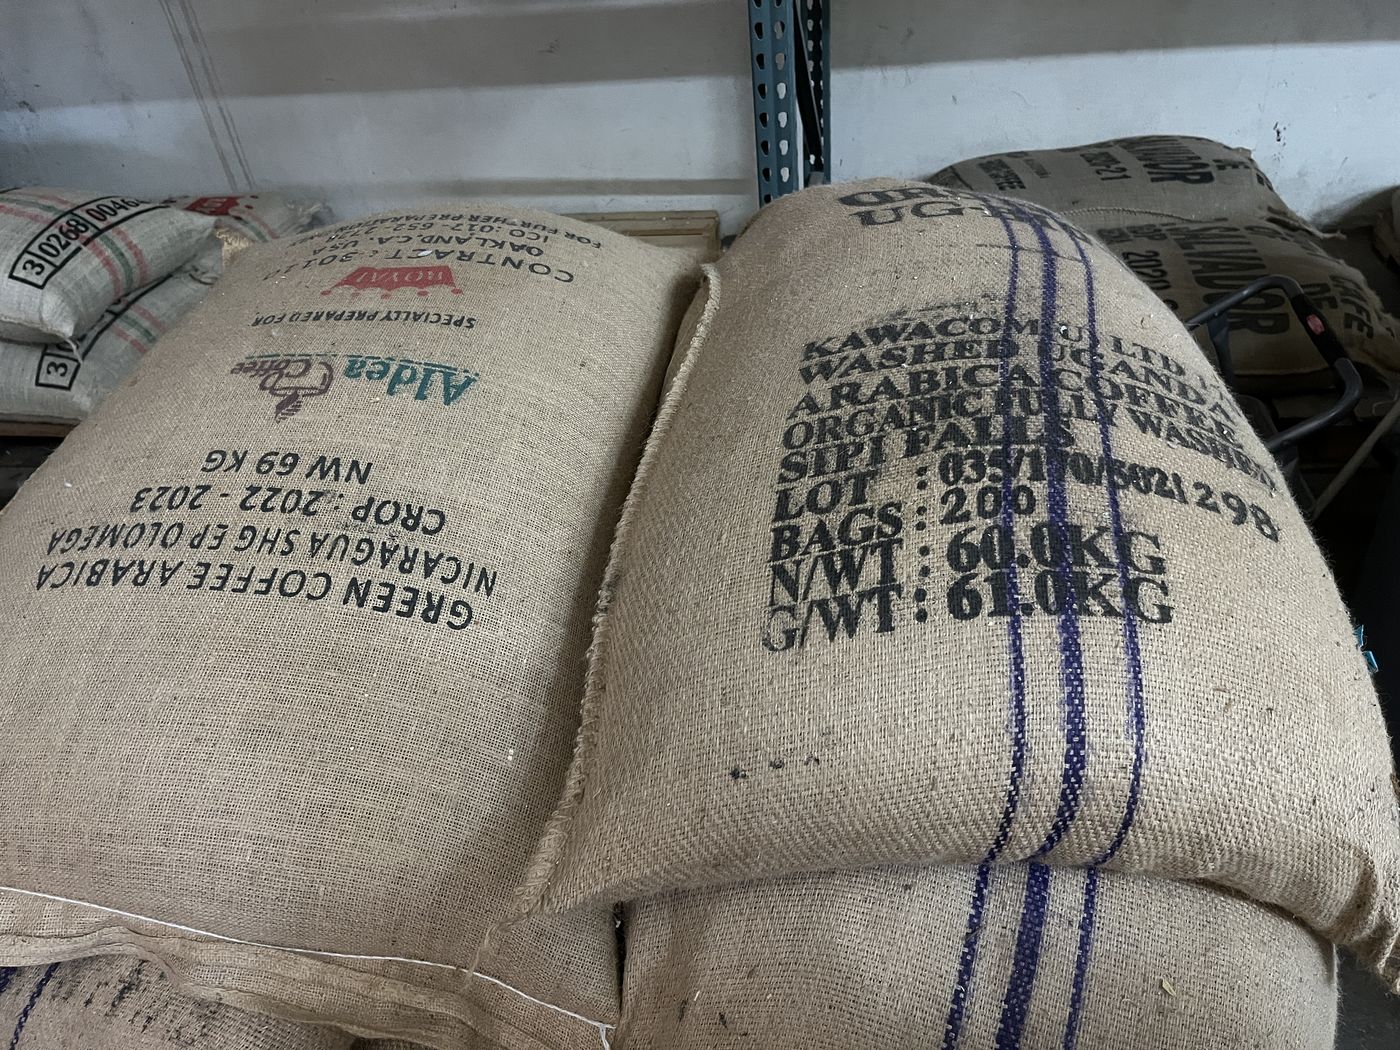
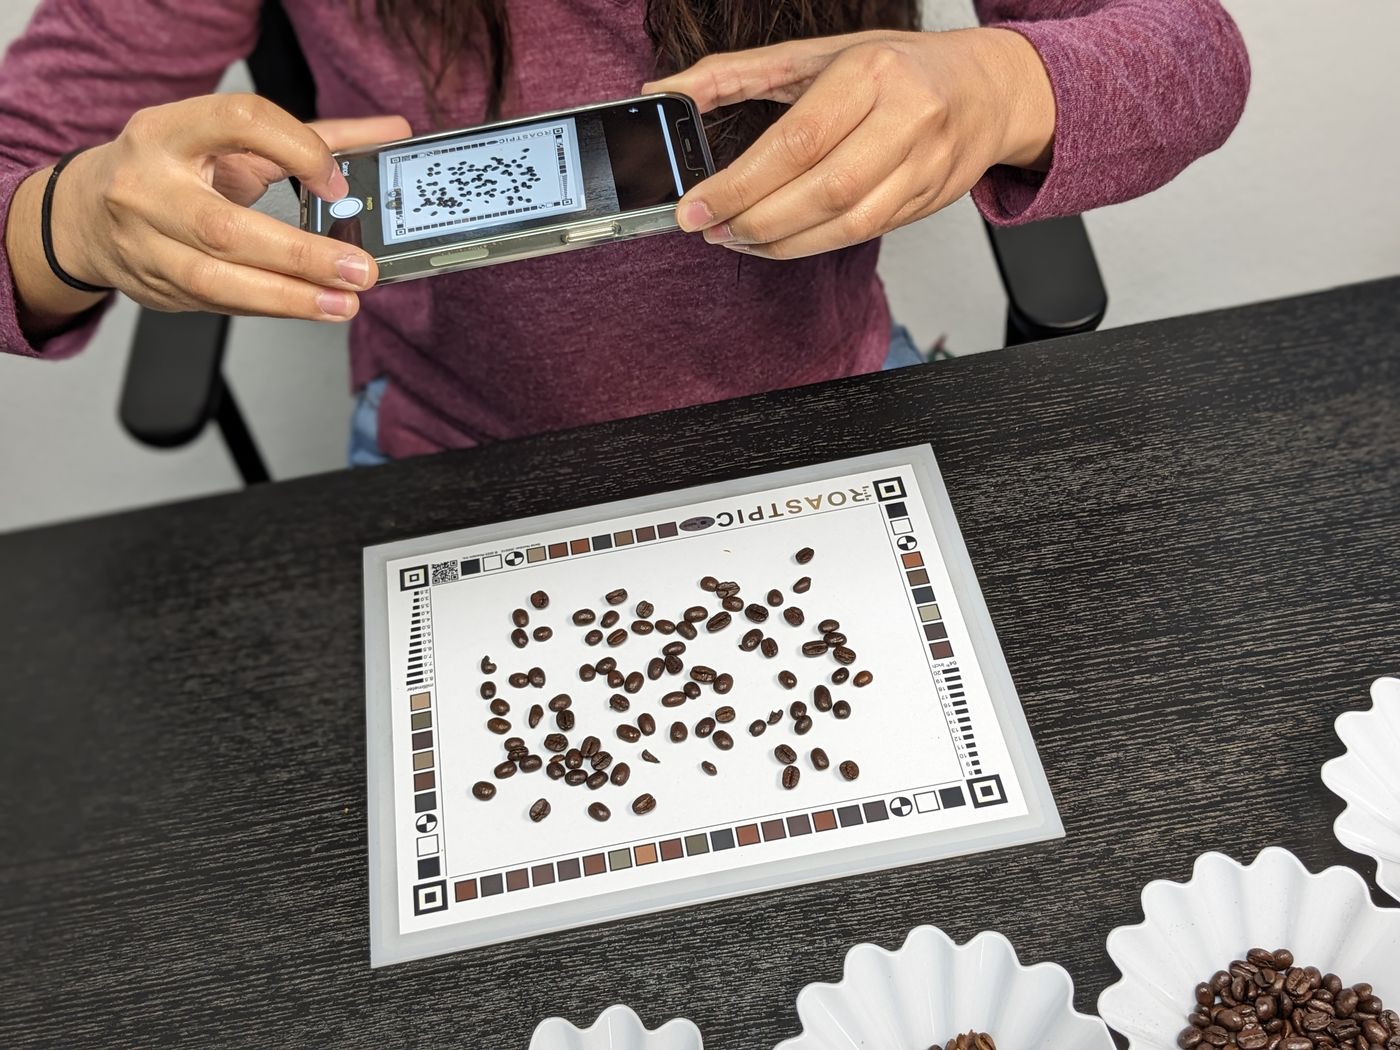
Across the roasteries I observed, quality control followed a recurring loop: prepare a batch, evaluate it, record the result, compare it with previous or target roasts, then use that information to adjust what comes next.
RoastPic supported the evaluation step, but the measurement it produced was often carried into the rest of the workflow through paper notes, spreadsheets, or other tools.
Scroll to see all seven stages →
 1
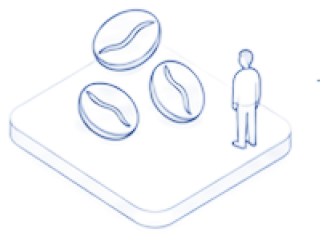
Green coffee / lot
Select the coffee to roast
Lot / origin records
1
Green coffee / lot
Select the coffee to roast
Lot / origin records
 2
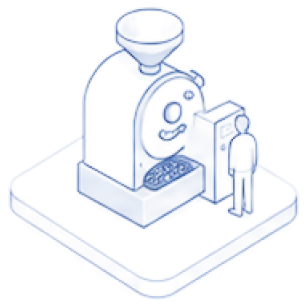
Roast batch
Roast toward a target profile
Roaster, time / temp data
2
Roast batch
Roast toward a target profile
Roaster, time / temp data
 3
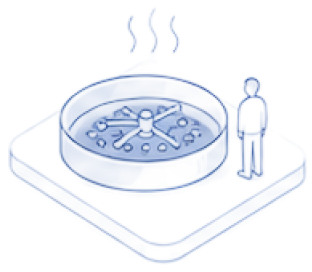
Cool & sample
Prepare a sample for QC
QC sample
3
Cool & sample
Prepare a sample for QC
QC sample
 4
Evaluate
Assess roast quality
Roast profile, cupping, RoastPic
4
Evaluate
Assess roast quality
Roast profile, cupping, RoastPic
 5
Log QC result
Save findings with context
Notes, software, records
5
Log QC result
Save findings with context
Notes, software, records
 6
Compare
Review against target or past roasts
Historical records
6
Compare
Review against target or past roasts
Historical records
 7
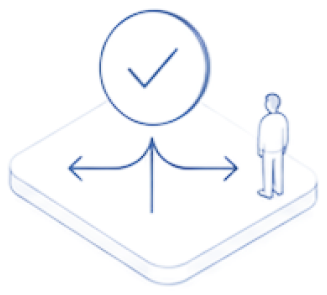
Decide / adjust
Approve or modify the next roast
Historical records
7
Decide / adjust
Approve or modify the next roast
Historical records
A single reading describes one sample. To understand consistency, roasters needed to know what the measurement belonged to, find it again, and compare it with previous results.
This helped define the boundary for the next release. RoastPic did not need to replace roast-profile, cupping, or inventory tools. It needed to make its own physical measurements useful beyond the moment they were captured.
Across the roasteries I visited, the same three needs kept appearing: measurements had to stay connected to their coffee, remain easy to find, and support comparison over time. I translated those patterns into three requirements for the next phase.
Nobody looked at a number on its own. They always asked which coffee and which batch it came from.
A result stops meaning anything the moment the app forgets what it was measuring.
Every measurement stays attached to its batch and its coffee.
People needed old results back, but they were spread across notebooks, spreadsheets and the app.
Producing a number was only half the job. It also had to be kept and findable.
A simple record of every measurement, searchable by coffee, date or label.
To judge a batch, people held it up against an earlier one or against a target.
What people wanted to know was rarely the number itself. It was what had changed.
Put any two batches side by side and show the difference.
How might we grow RoastPic from a single-use measuring tool into a lightweight physical QC record — retrievable, trustworthy, comparable.
Any measurement can be found again months later, by the coffee it belongs to rather than the day it was taken.
A saved reading keeps the photo and the context it came from, so it can be checked rather than taken on faith.
Two readings of the same coffee can sit side by side and be read as a change, not as two unrelated numbers.
Structure
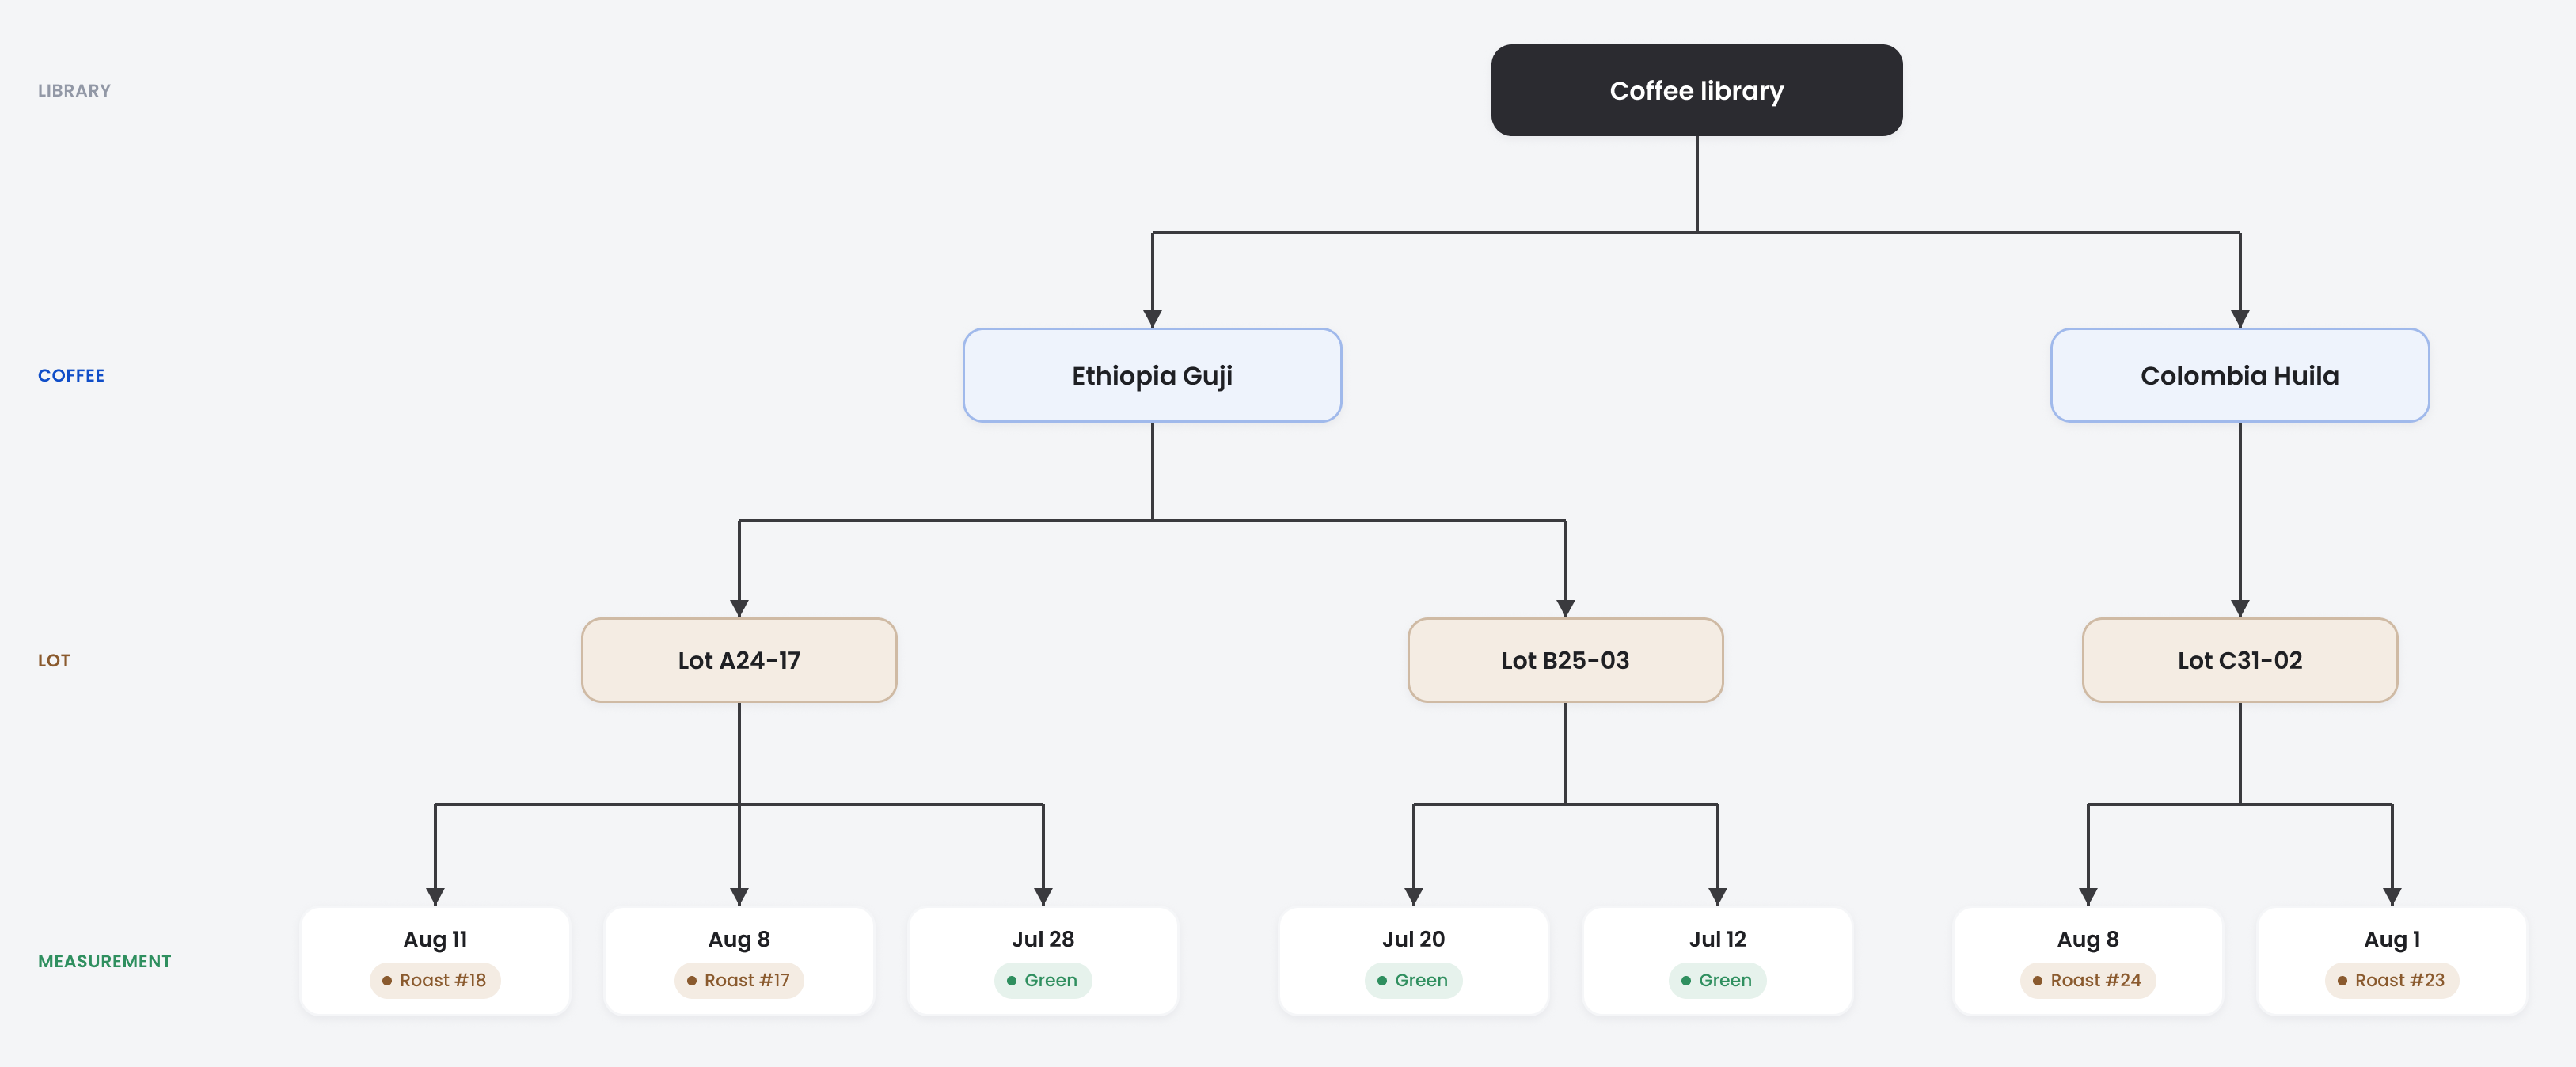
Before designing the new screens, I mapped the information structure around the way roasters already identified their work. Rather than treating every scan as a standalone result, RoastPic would organize measurements under the coffee and lot they belonged to. This gave saving, history, search, and comparison a shared structure.
Design
Each of the three principles became its own part of the product: a way to give a reading a name, a place for it to live, and a way to read two of them as a change.
Saving happens right after a photo is analysed, while the roaster still remembers what they just made. The screen asks for the two things that identify a batch — which coffee it came from, and which roast of that coffee it is — and fills in as much of that as it can guess.
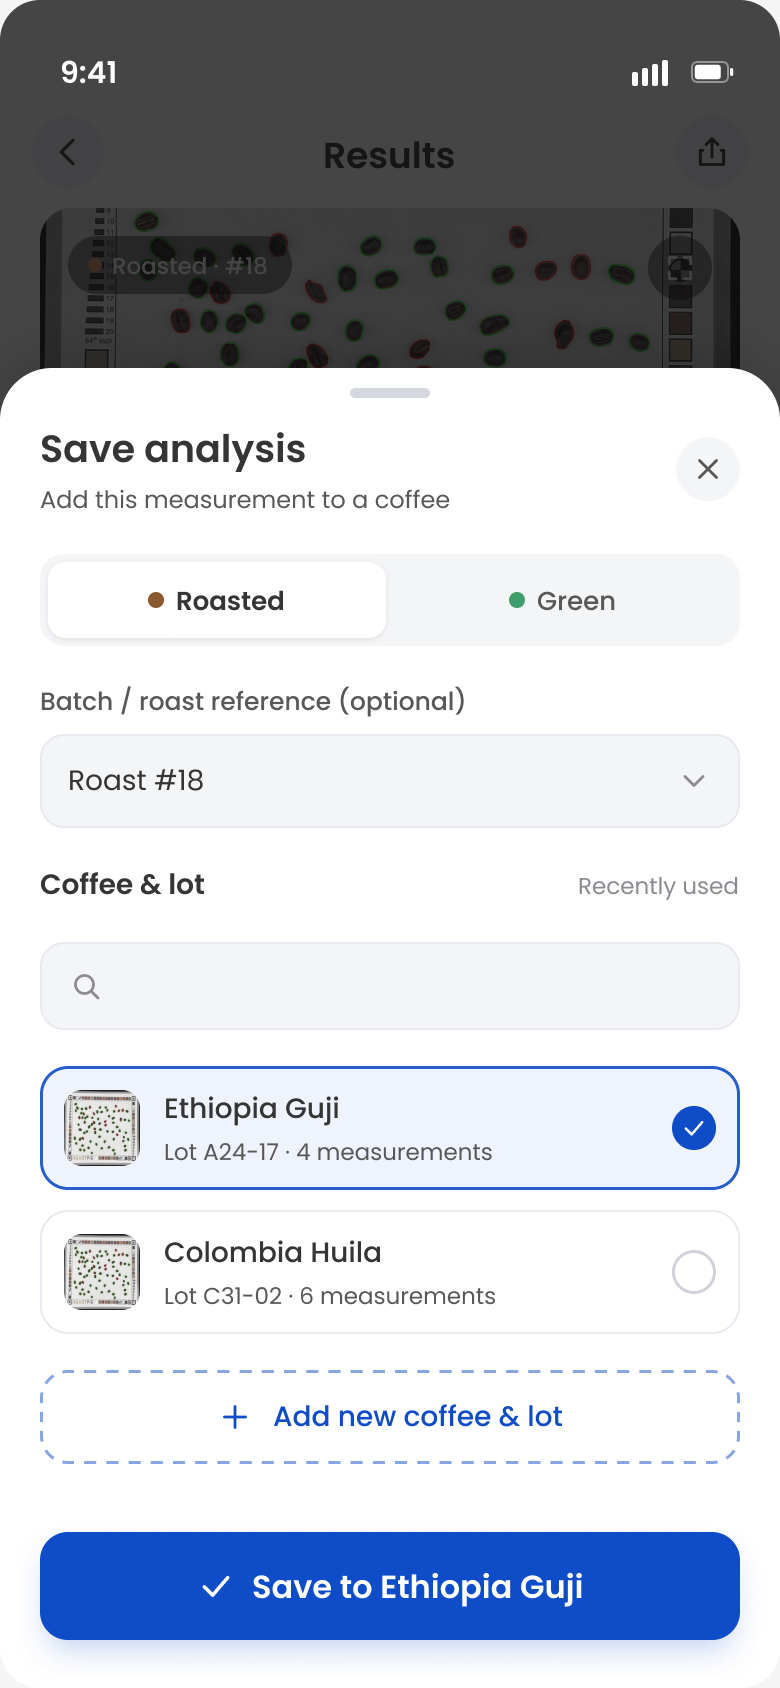
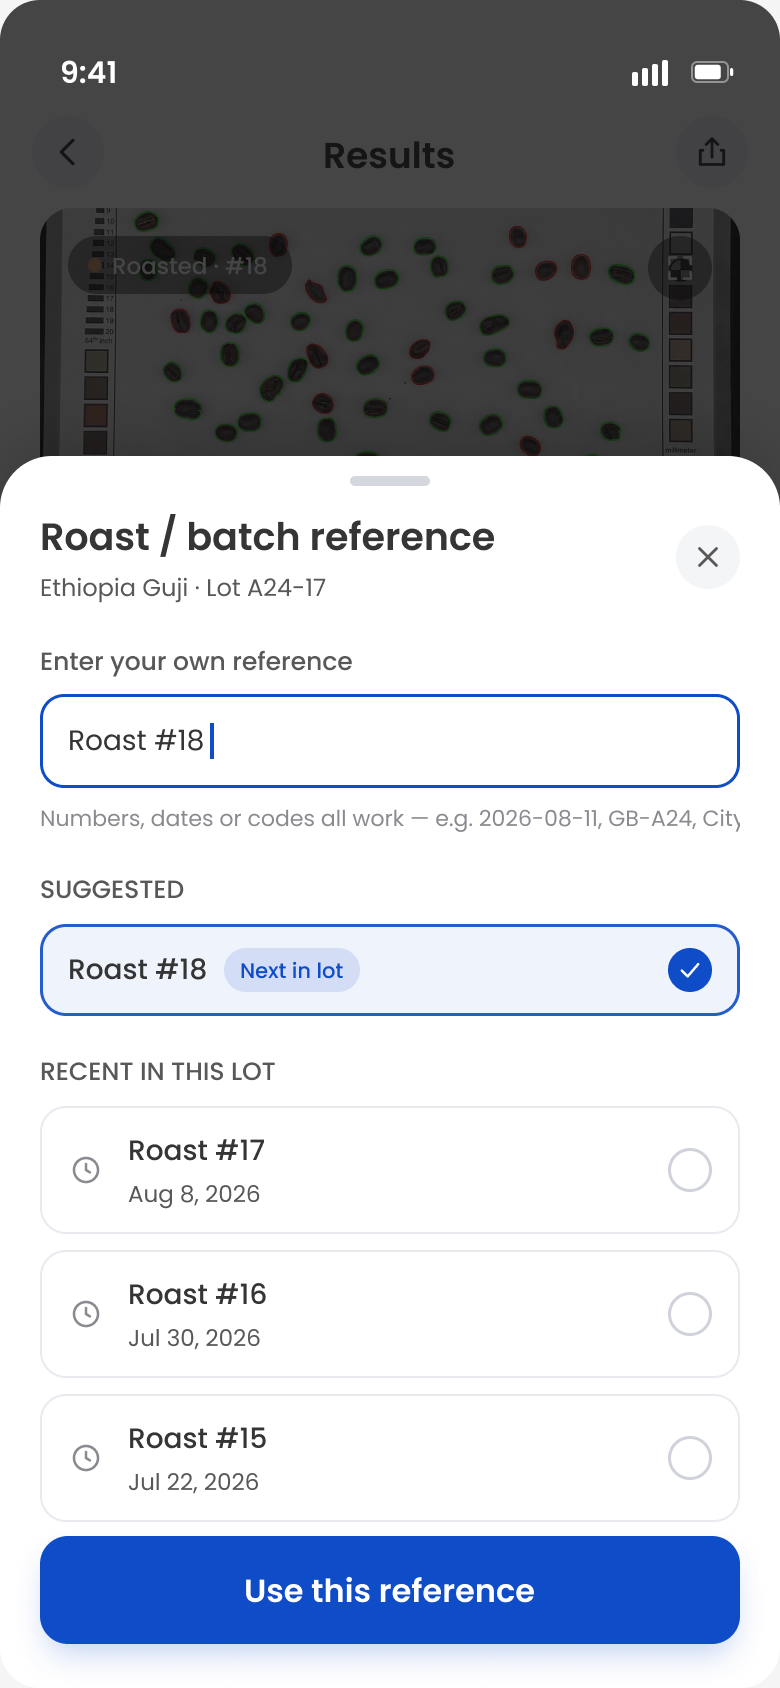
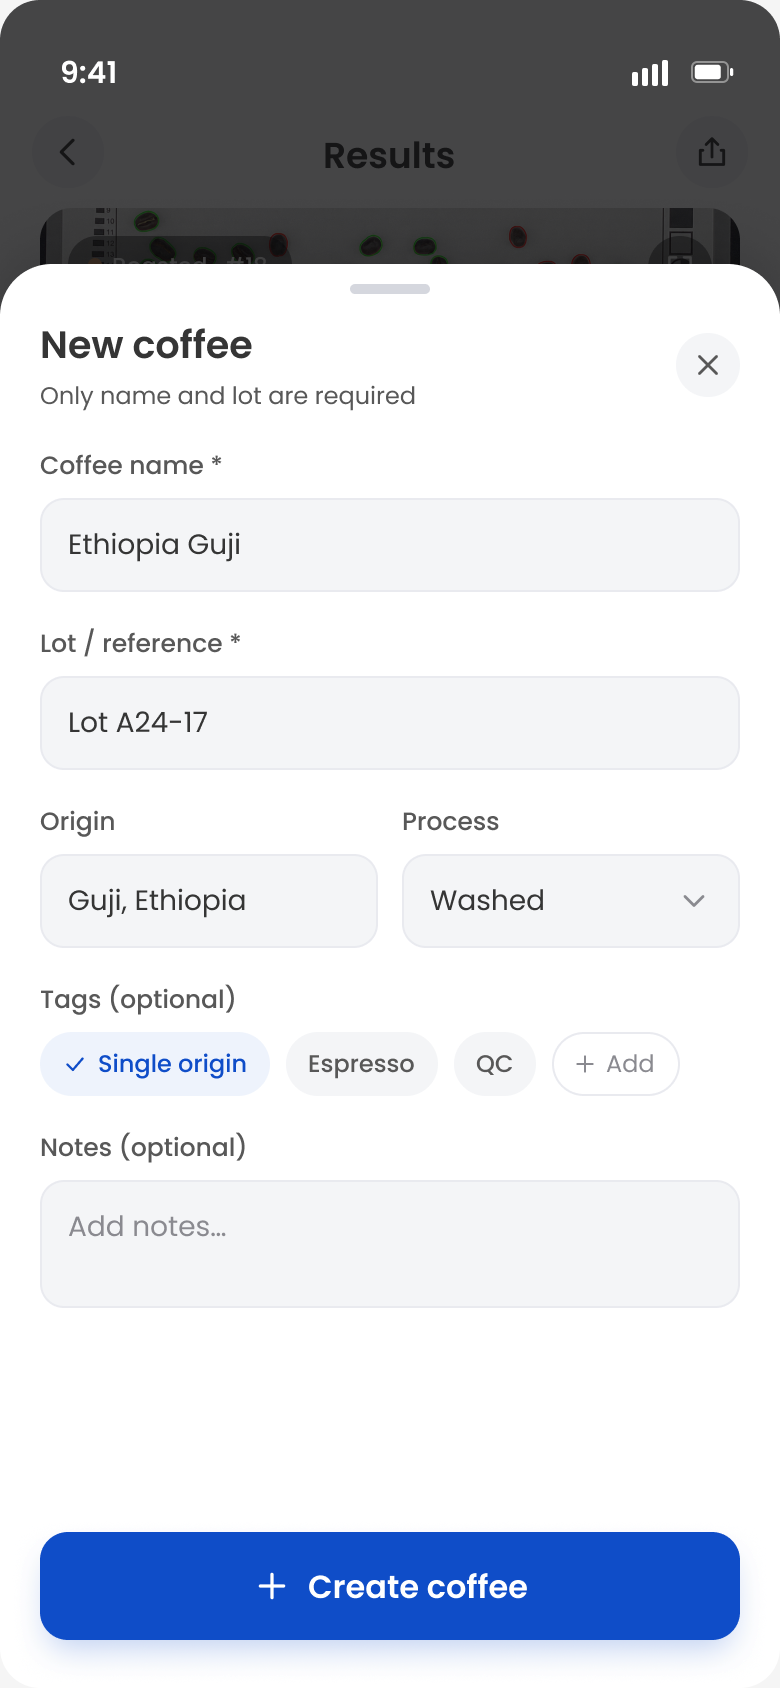
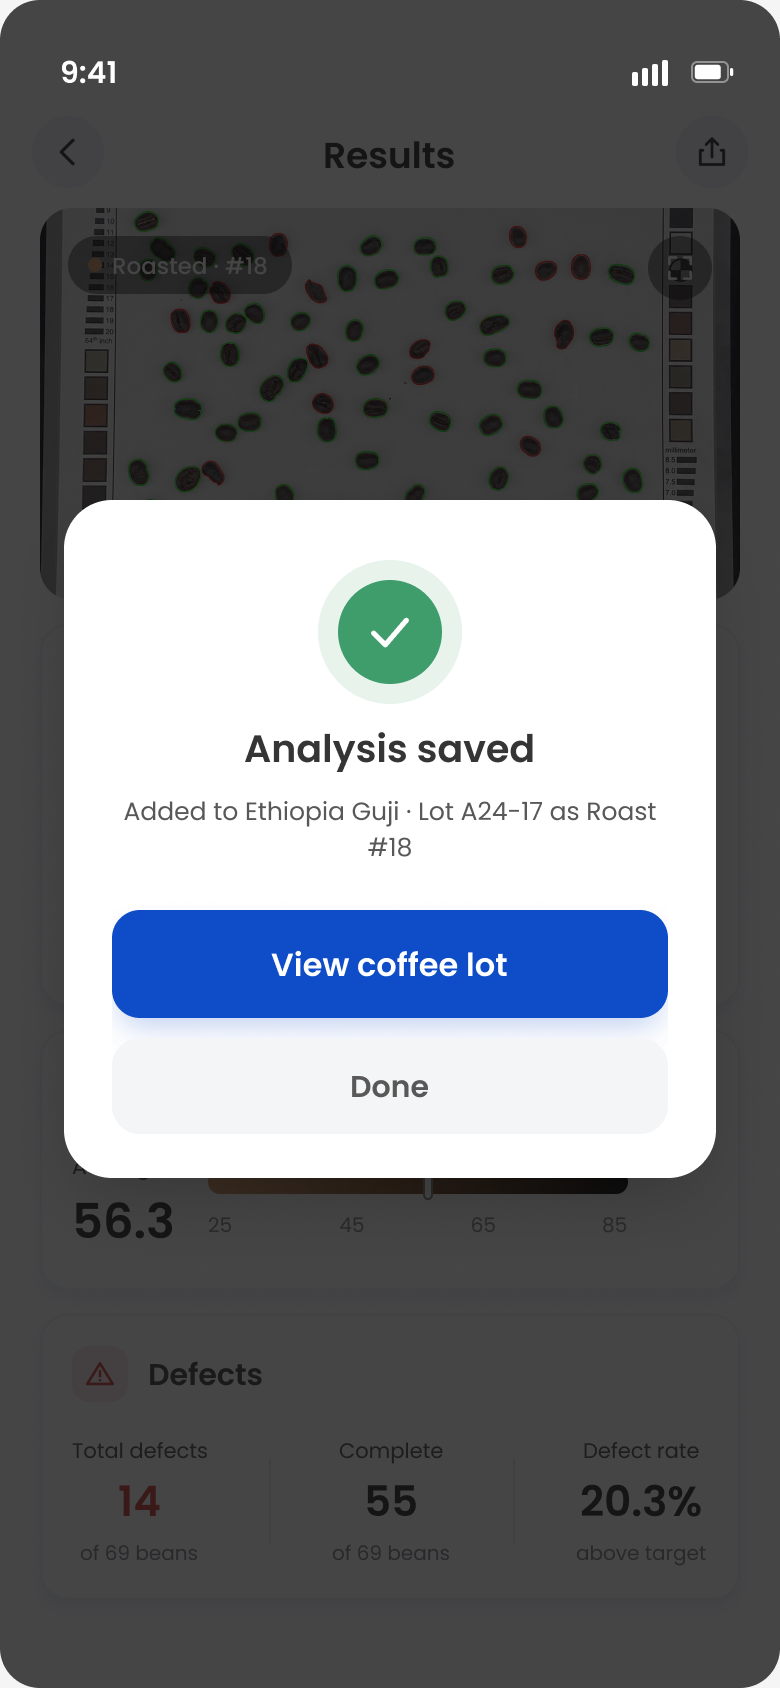
A coffee is measured twice in its life, green and roasted, and the same photo means different things in each case. So the app asks first.
Optional, and already filled in with the next roast in the sequence. The common save needs no typing.
A coffee the app has never seen needs a name and a lot. Everything else can wait.
The full name read back, so a misfiled measurement is caught now rather than months later.
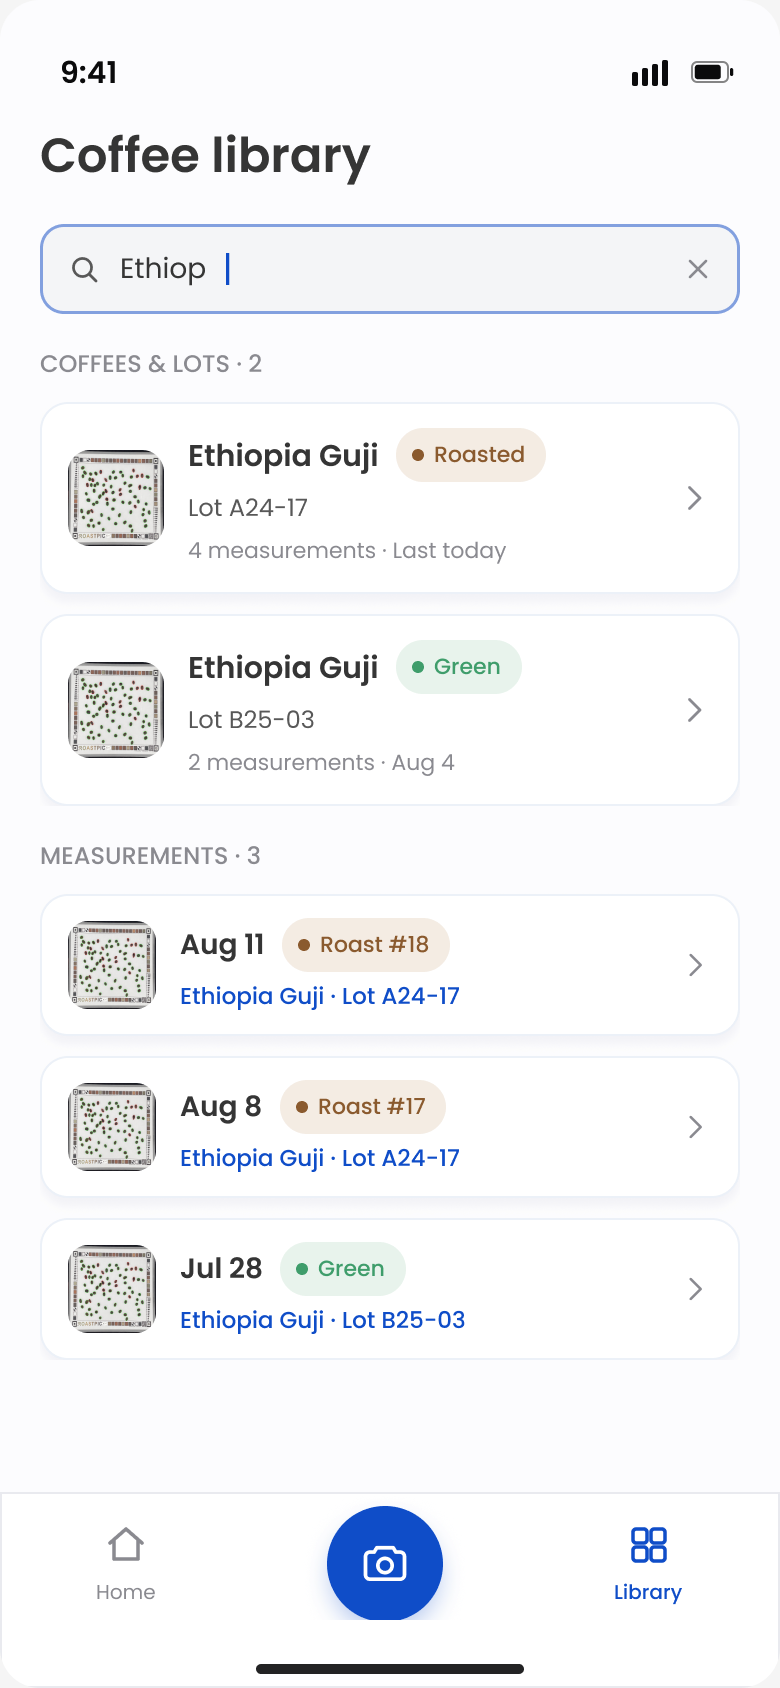
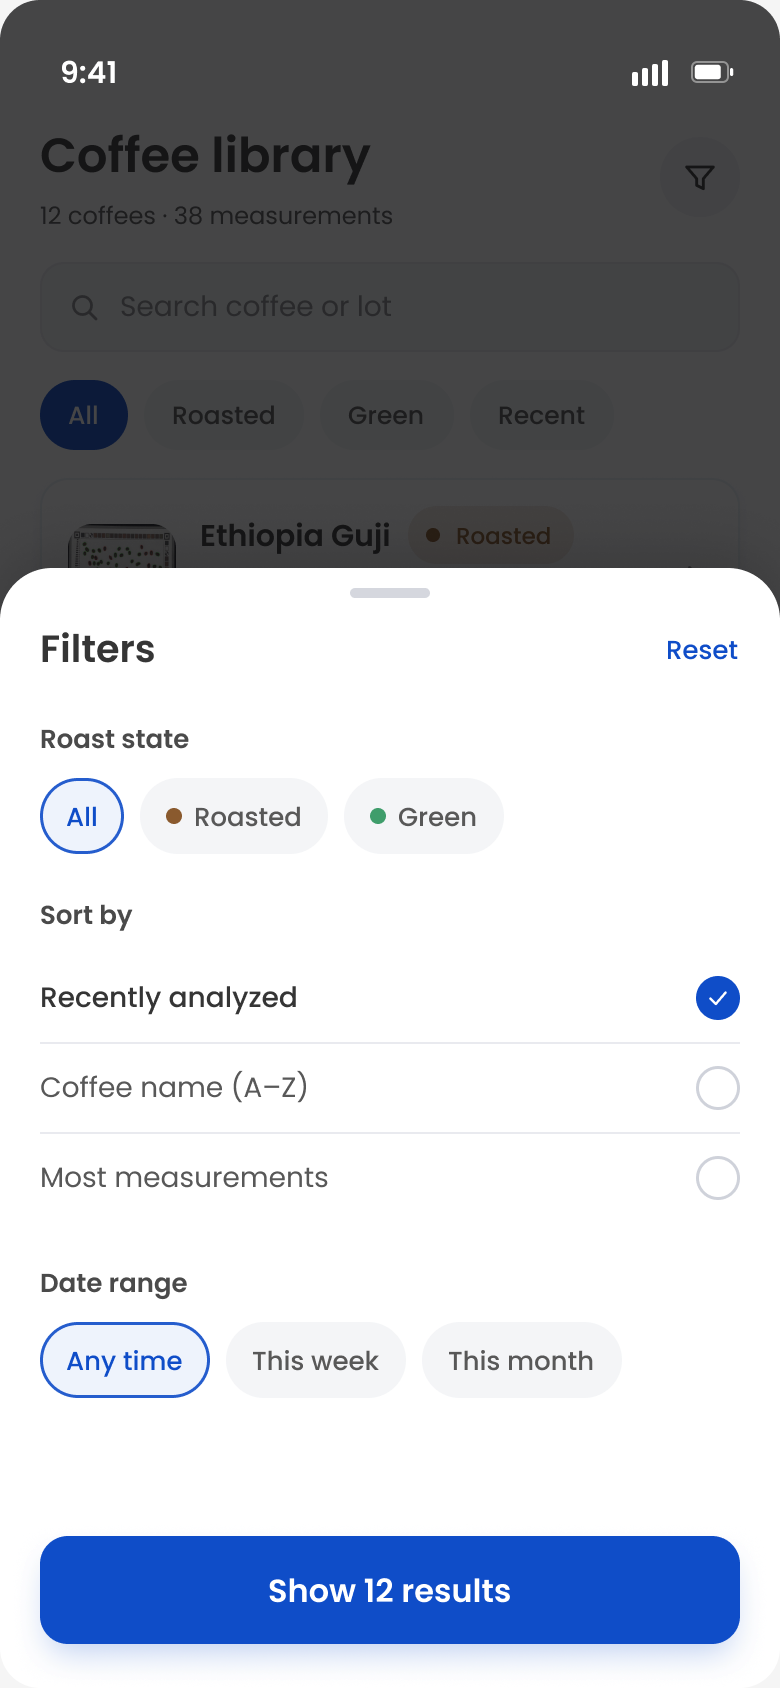
Once results are being kept, they need a place a roaster can walk back into. The library is organised the way roasters already think — by coffee, and by the particular purchase of that coffee — rather than by the day a photo happened to be taken.
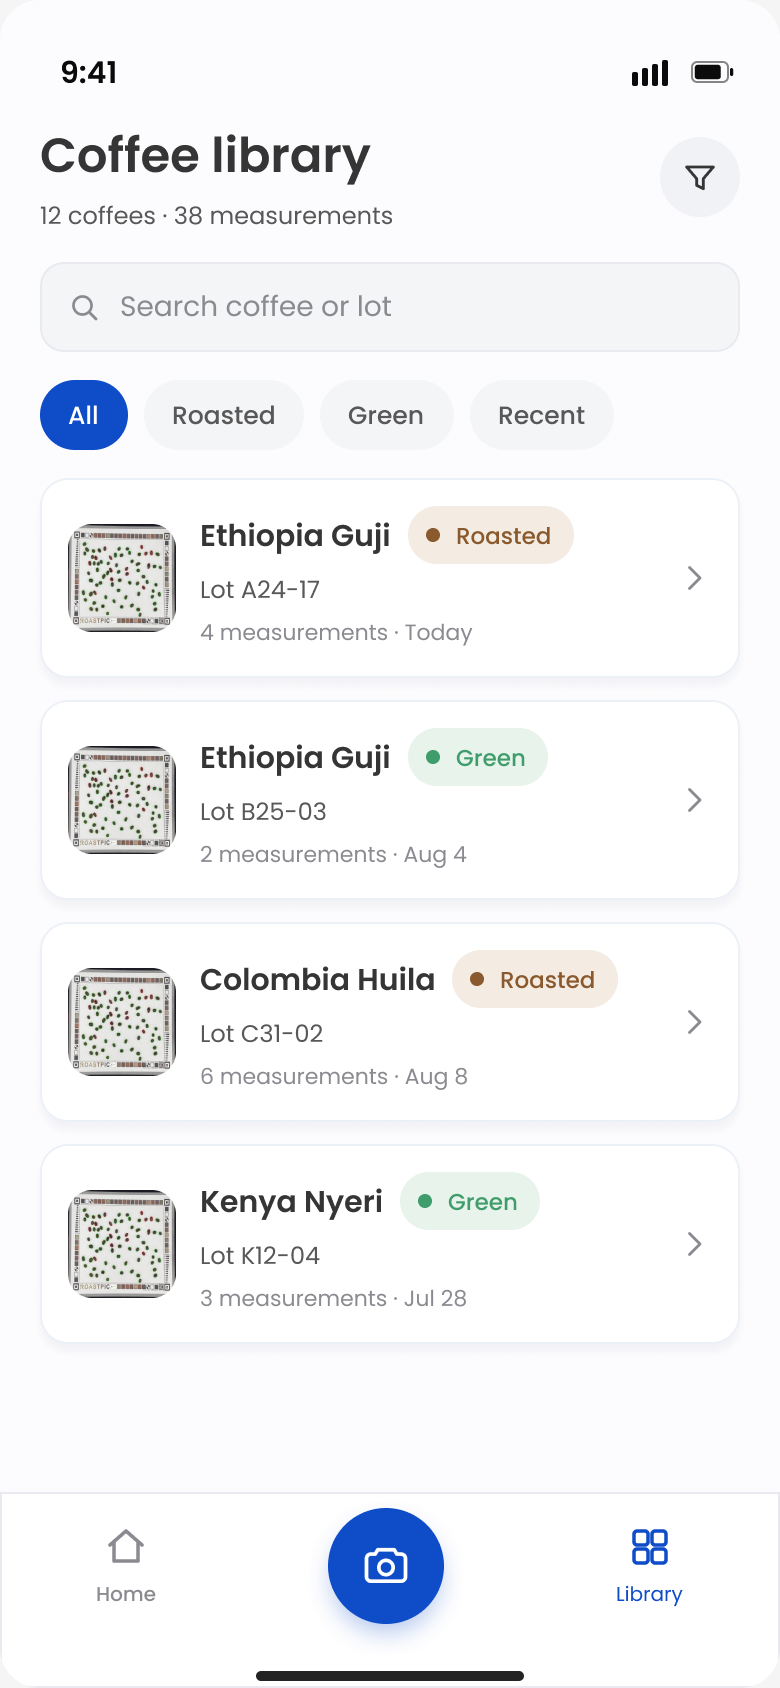
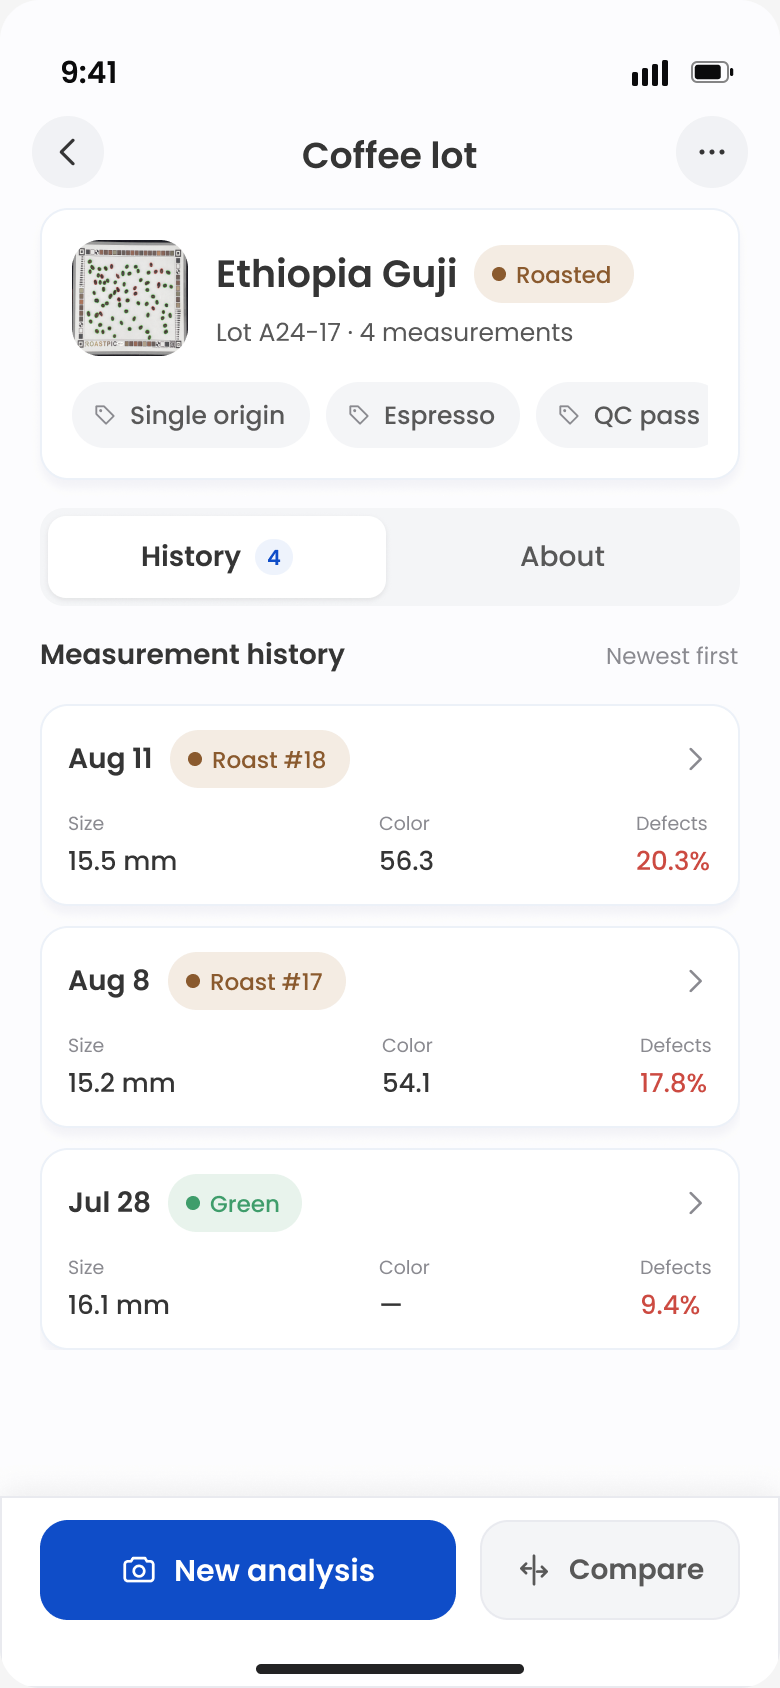
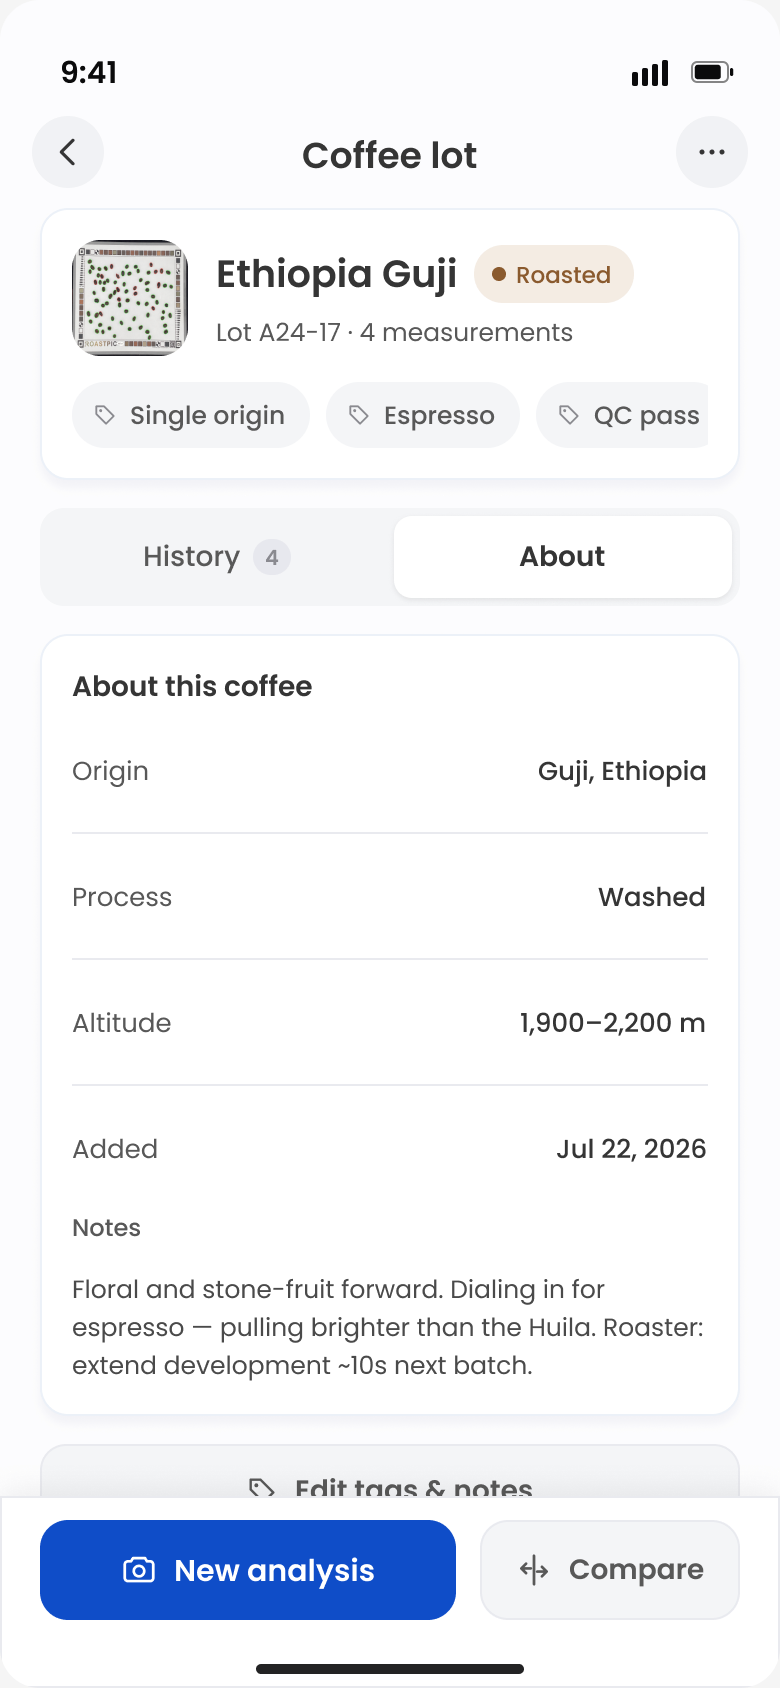
The unit on screen matches the unit roasters talk in. Dates sit inside a coffee, not above it.
All three numbers sit on the row, newest first, so a drift is visible without opening anything.
Origin, process and notes get their own tab, which keeps the history a clean list of events.
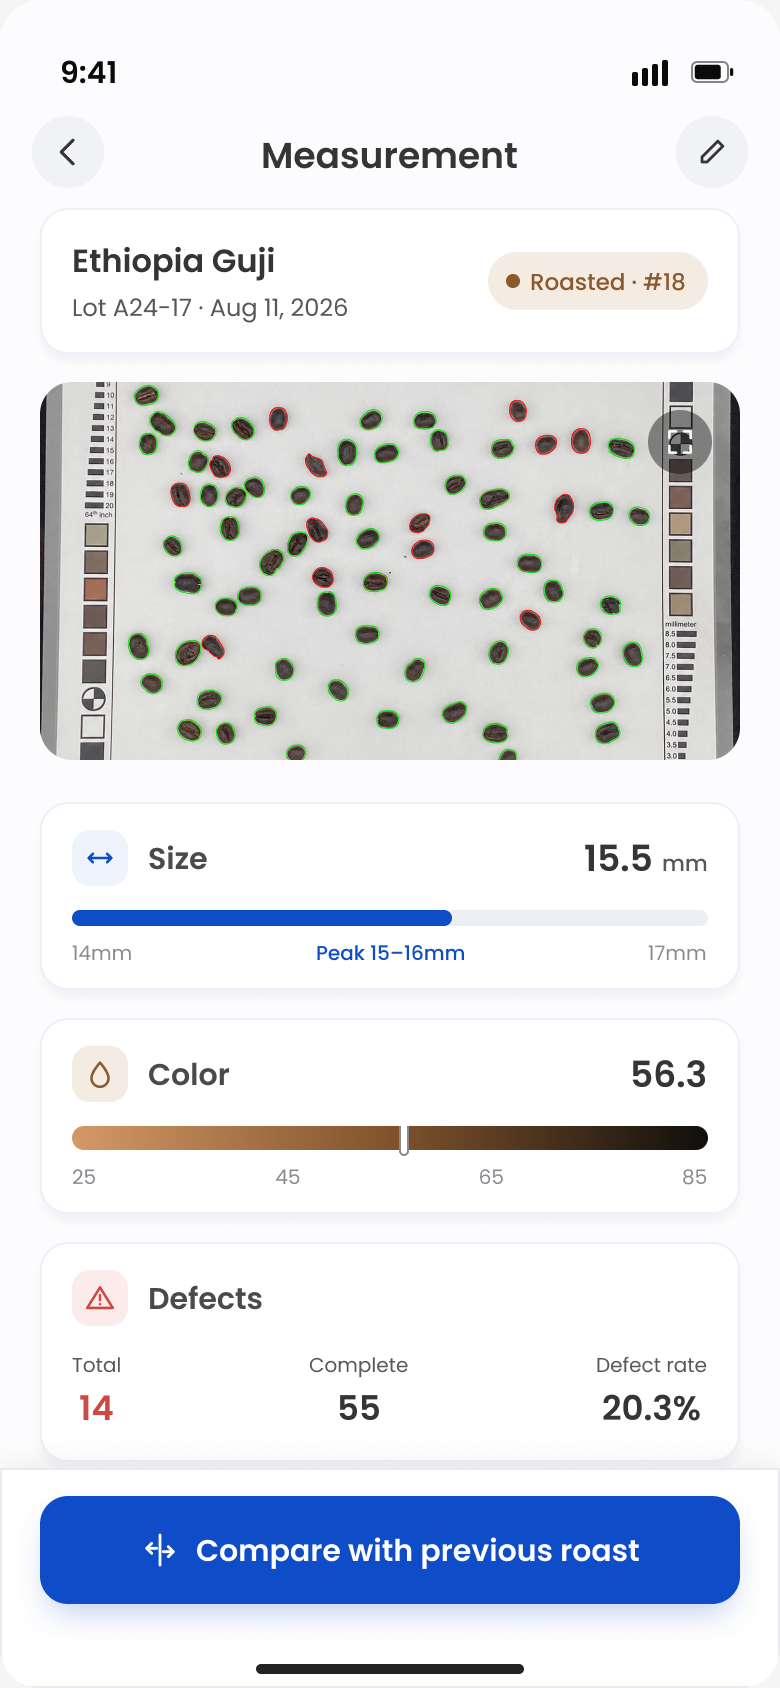
The photo stays with the reading, and each number sits on a bar marked with its normal range.
A library is only as good as its worst day
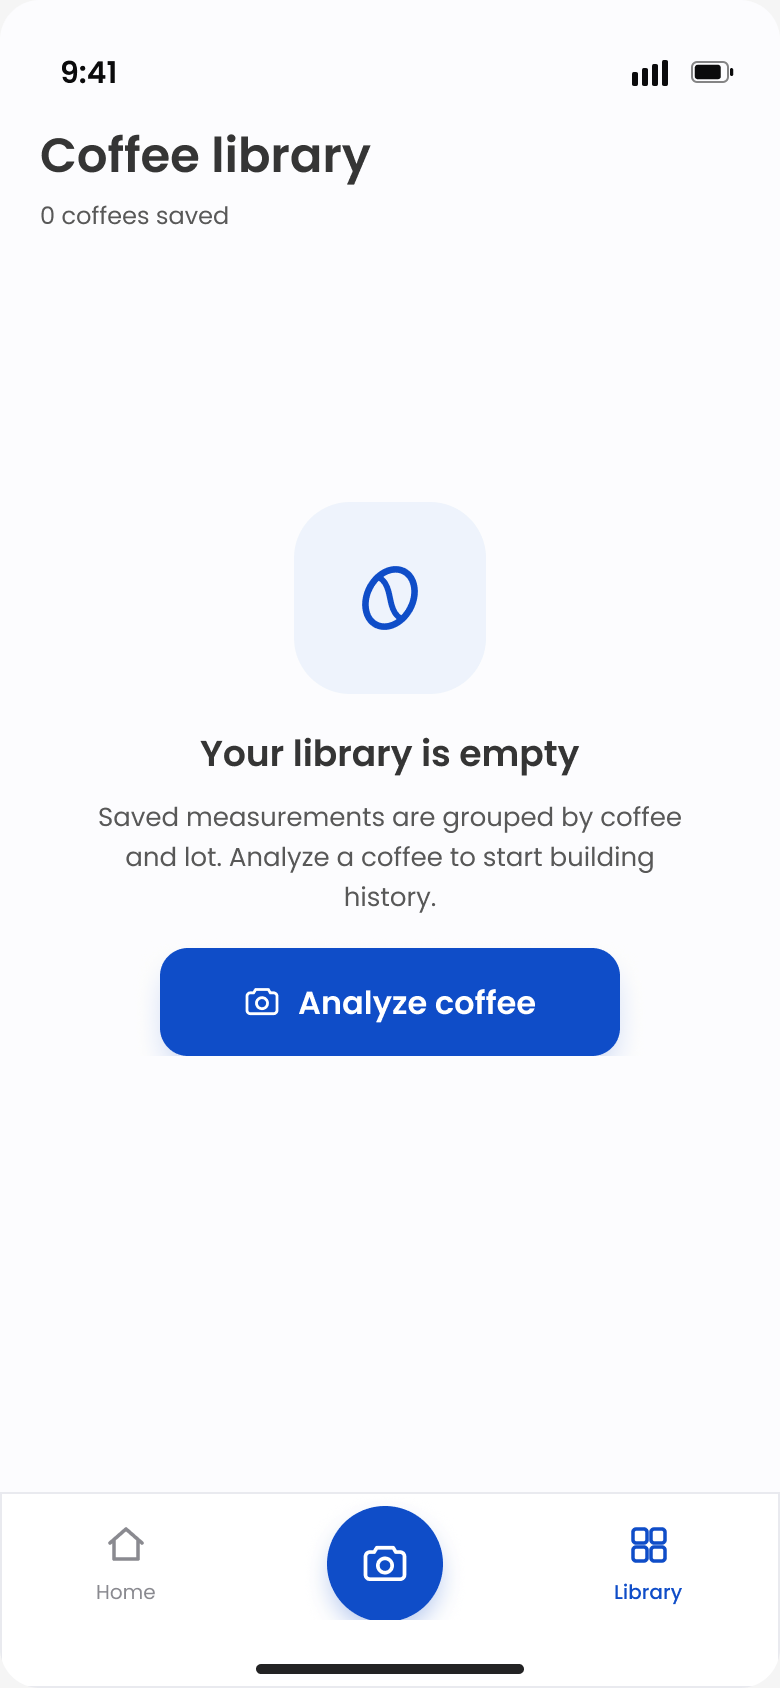
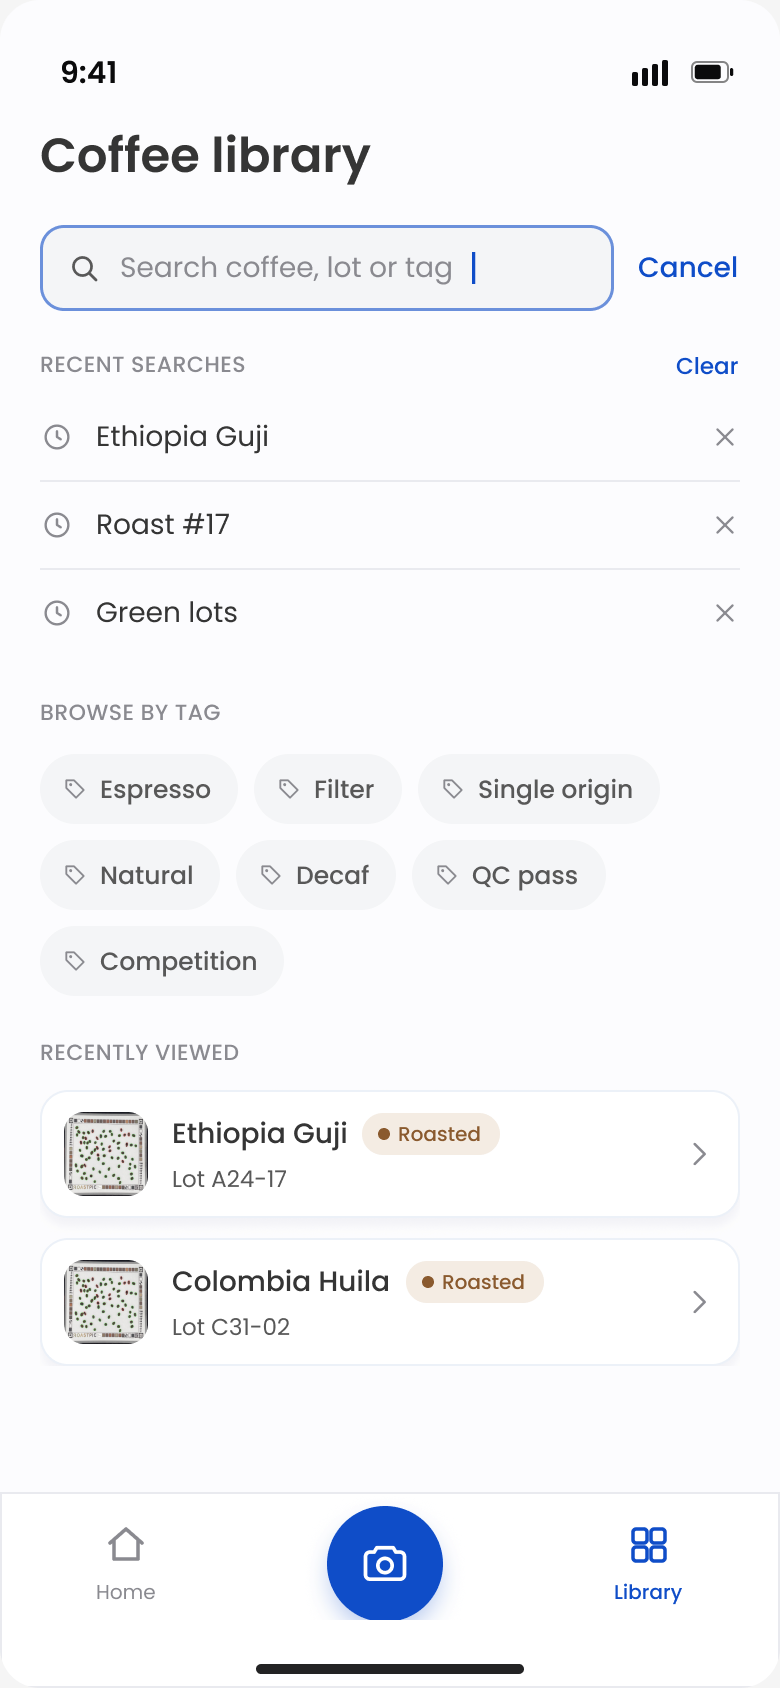
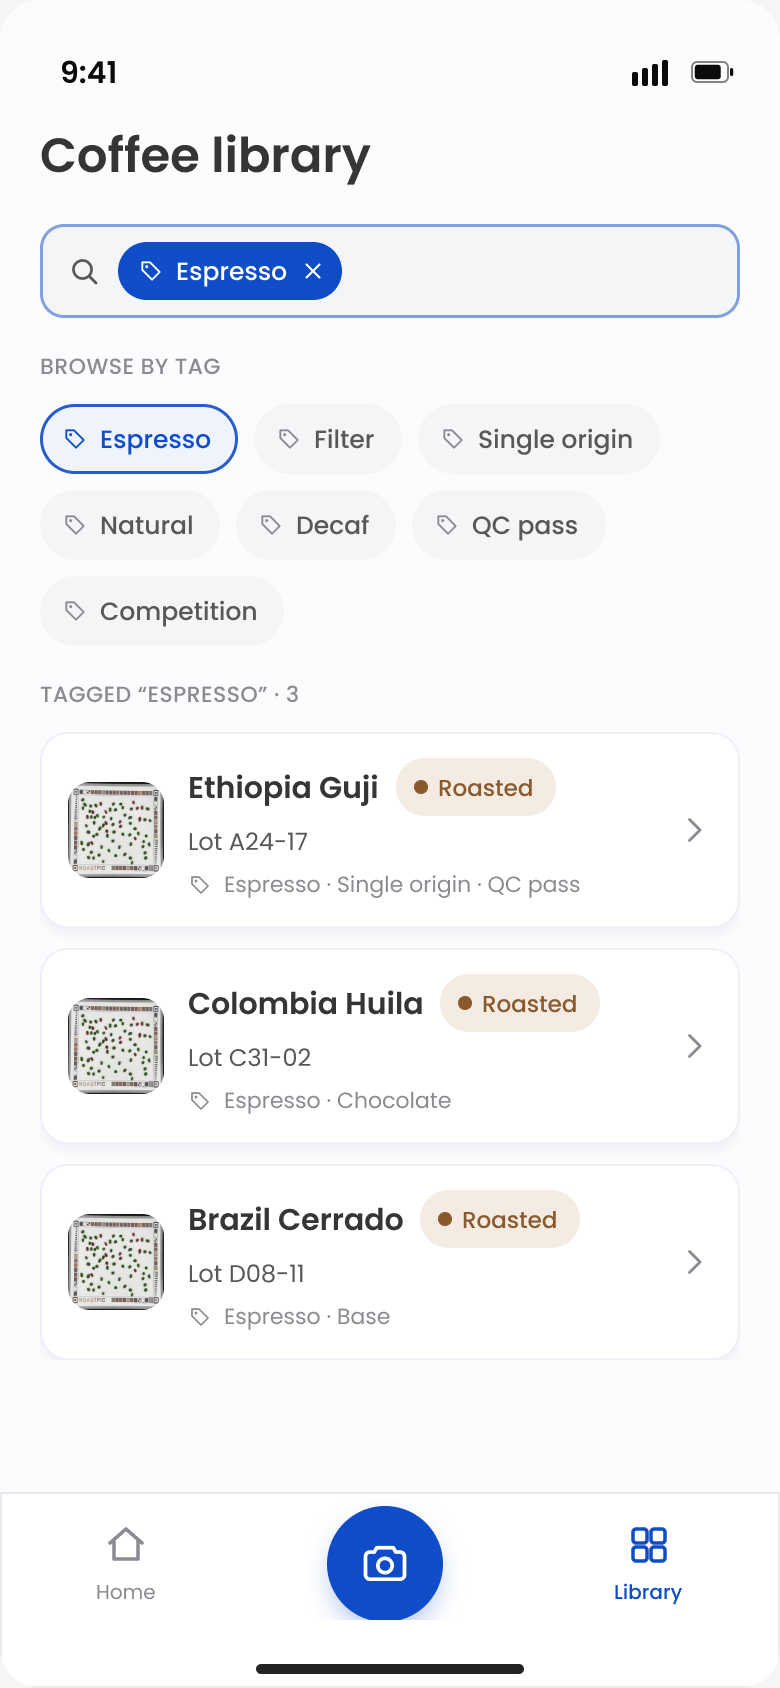
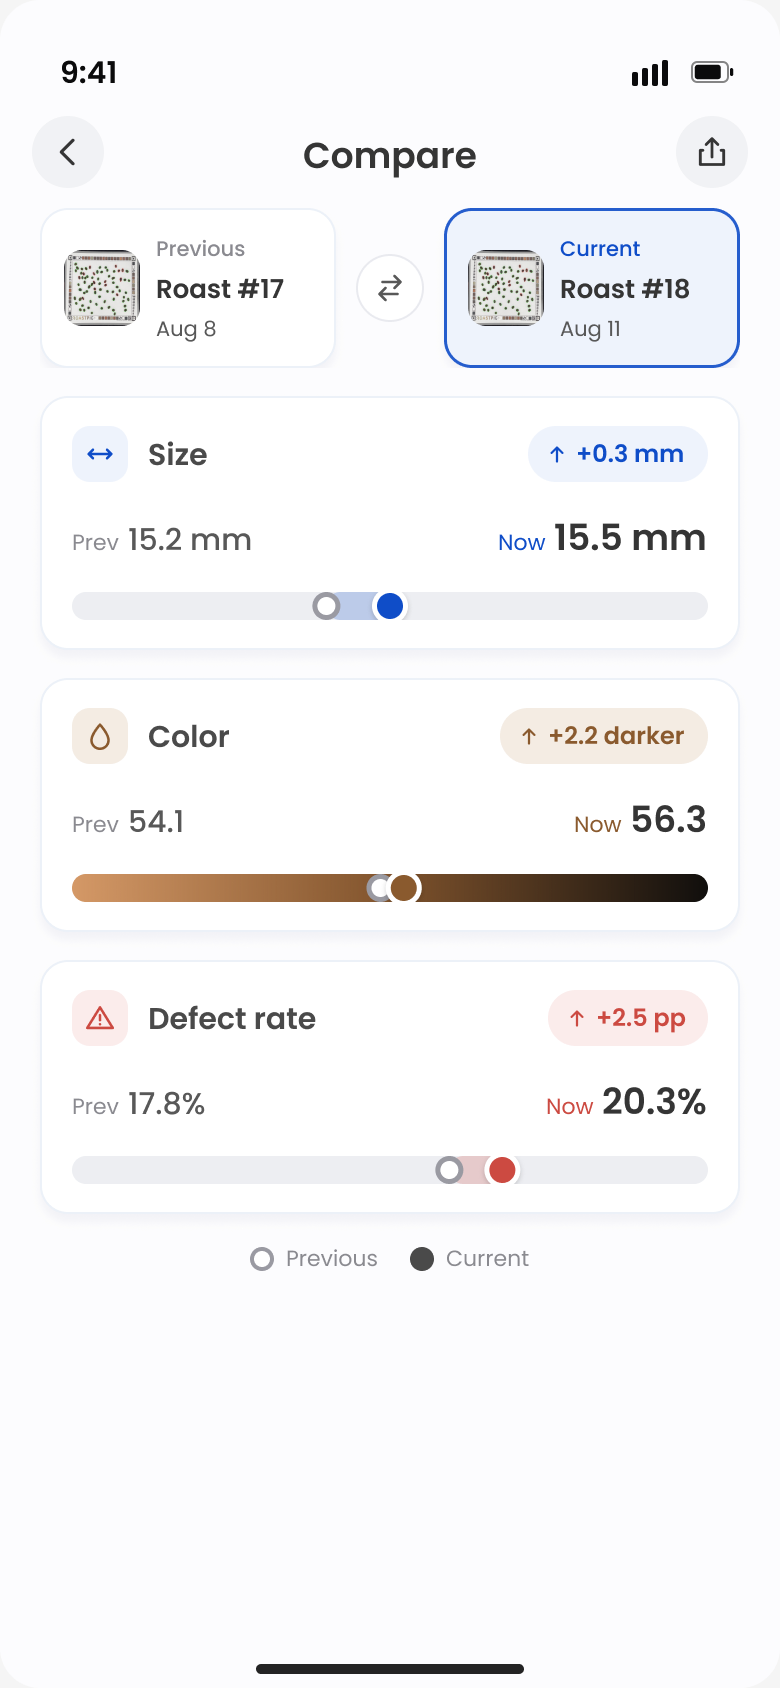
This is the piece roasters asked for most directly. A single measurement rarely answers a question on its own — what they want to know is whether this batch came out different from the last one, and in which direction.
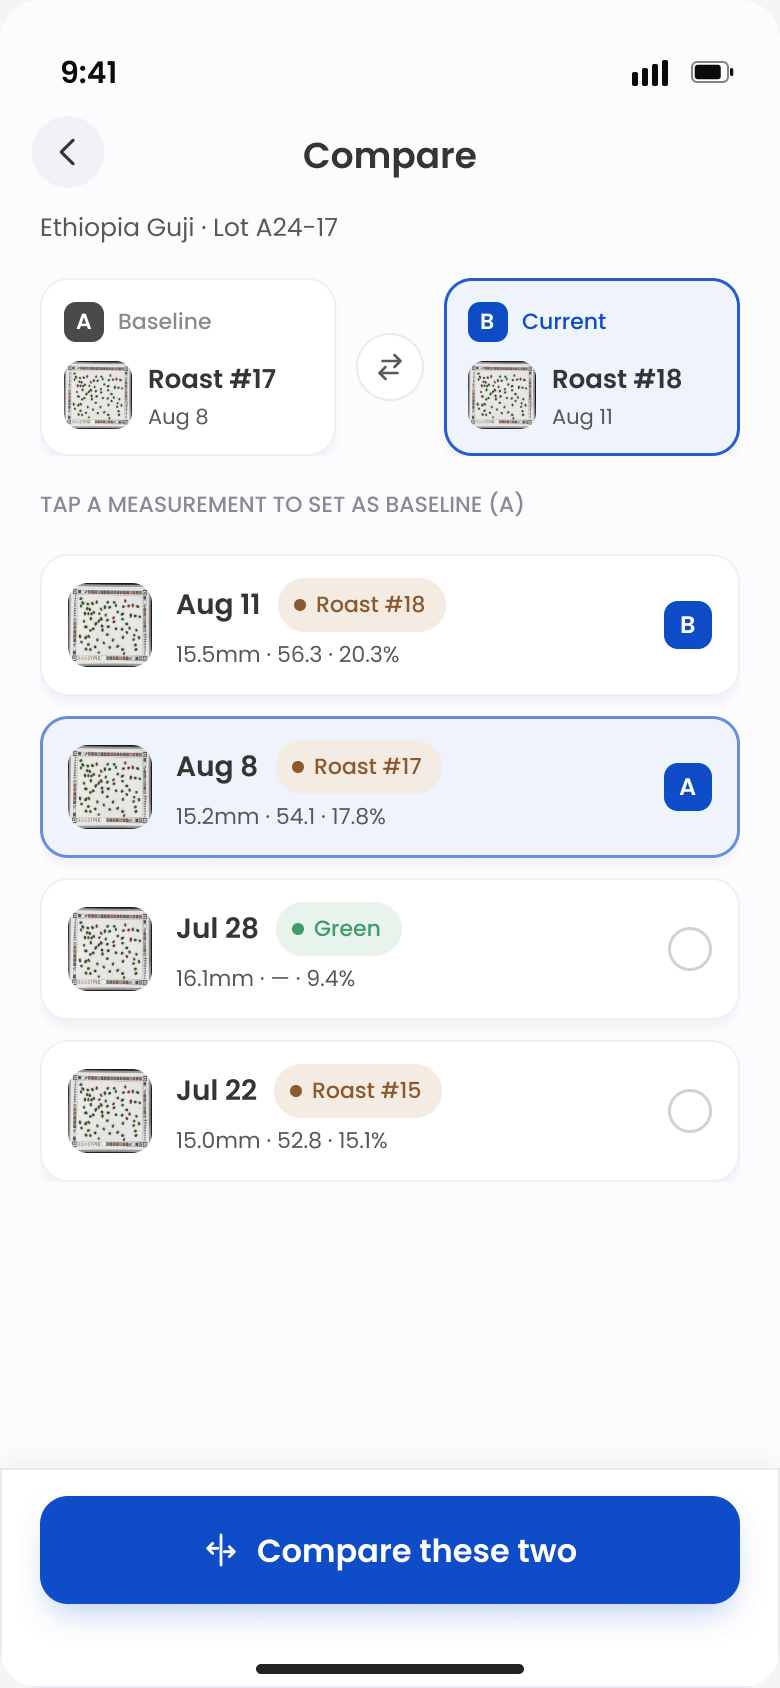
Both readings come from the same coffee, so the app can never compare two things that were never comparable.
The change leads and the raw readings sit underneath. Colour carries meaning, not direction — a climbing defect rate turns red, a darker roast stays neutral.
Outcome
The technology worked early. What changed was what it was for — not a way to read three numbers off a photo, but a lightweight quality record a small roastery could actually keep. A proven measurement and a product that reached past it made a far stronger case together than either did alone, and that is what the next round of funding was raised against.
How closely the app's numbers matched the professional instruments we tested it against.
Coffee roasters around Davis and Northern California who used it on real batches.
Early funding helped support the next stage of development.
Reflection
Most of this project was spent deciding what not to do. As the only designer at a startup, nobody hands you a scoped problem — you get an ambiguous one, and the first real piece of work is turning it into something small enough to build. Sitting with that ambiguity, rather than rushing to draw screens, is the part I got better at.
In a small team it is easy for everyone to be enthusiastic about slightly different products. Ambition arrives faster than capacity, and the instinct is to build all of it at once. A lot of my value came from keeping us pointed at one thing at a time and making sure we all meant the same thing by it.
Deciding not to build a full quality-control suite was as much a business call as a design one: who we could realistically compete with, what roasteries already paid for, and what we could support with the team we had. I could only argue for the narrow scope because I understood those constraints, not just the interface.
This work did not start as a design brief. It started with usage going quiet and nobody being sure why. Going out and mapping the work is what turned that into a direction the whole team could get behind — which taught me that a designer at this stage is shaping where the product goes, not only what it looks like.